29
/
en
AIzaSyAYiBZKx7MnpbEhh9jyipgxe19OcubqV5w
April 1, 2024
257762
Switzerland
CHE
true
2
1
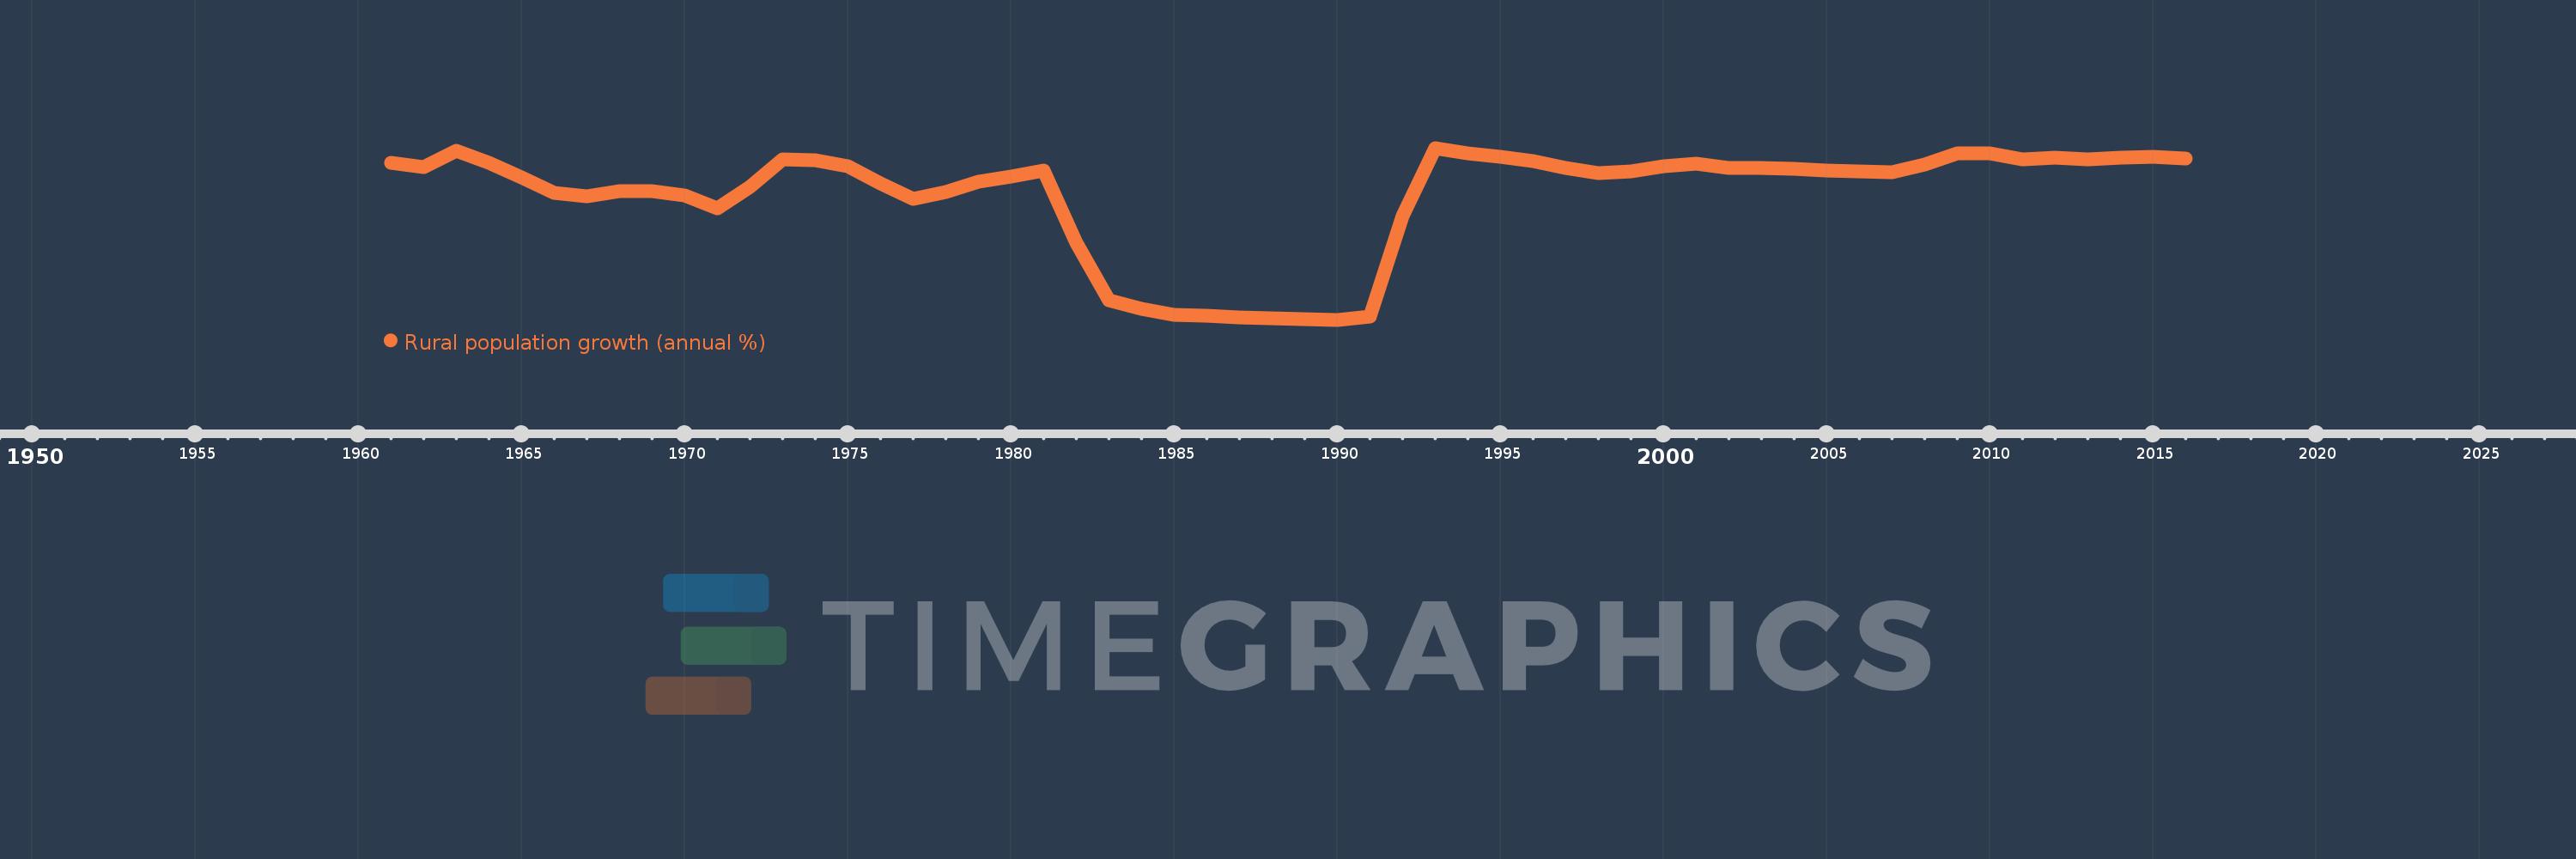
Rural population growth (annual %)
2016,2015,2014,2013,2012,2011,2010,2009,2008,2007,2006,2005,2004,2003,2002,2001,2000,1999,1998,1997,1996,1995,1994,1993,1992,1991,1990,1989,1988,1987,1986,1985,1984,1983,1982,1981,1980,1979,1978,1977,1976,1975,1974,1973,1972,1971,1970,1969,1968,1967,1966,1965,1964,1963,1962,1961
This statistics in other country:
AfghanistanAlbaniaAlgeriaAmerican SamoaAndorraAngolaAntigua and BarbudaArab WorldArgentinaArmeniaArubaAustraliaAustriaAzerbaijanBahamas, TheBahrainBangladeshBarbadosBelarusBelgiumBelizeBeninBhutanBoliviaBosnia and HerzegovinaBotswanaBrazilBritish Virgin IslandsBrunei DarussalamBulgariaBurkina FasoBurundiCabo VerdeCambodiaCameroonCanadaCaribbean small statesCentral African RepublicCentral Europe and the BalticsChadChannel IslandsChileChinaColombiaComorosCongo, Dem. Rep.Congo, Rep.Costa RicaCote d'IvoireCroatiaCubaCuracaoCyprusCzech RepublicDenmarkDjiboutiDominicaDominican RepublicEarly-demographic dividendEast Asia & PacificEast Asia & Pacific (excluding high income)East Asia & Pacific (IDA & IBRD countries)EcuadorEgypt, Arab Rep.El SalvadorEquatorial GuineaEritreaEstoniaEthiopiaEuro areaEurope & Central AsiaEurope & Central Asia (excluding high income)Europe & Central Asia (IDA & IBRD countries)European UnionFaroe IslandsFijiFinlandFragile and conflict affected situationsFranceFrench PolynesiaGabonGambia, TheGeorgiaGermanyGhanaGreeceGreenlandGrenadaGuamGuatemalaGuineaGuinea-BissauGuyanaHaitiHeavily indebted poor countries (HIPC)High incomeHondurasHong Kong SAR, ChinaHungaryIBRD onlyIcelandIDA & IBRD totalIDA blendIDA onlyIDA totalIndiaIndonesiaIran, Islamic Rep.IraqIrelandIsle of ManIsraelItalyJamaicaJapanJordanKazakhstanKenyaKiribatiKorea, Dem. People’s Rep.Korea, Rep.KuwaitKyrgyz RepublicLao PDRLate-demographic dividendLatin America & Caribbean Latin America & Caribbean (excluding high income)Latin America & the Caribbean (IDA & IBRD countries)LatviaLeast developed countries: UN classificationLebanonLesothoLiberiaLibyaLiechtensteinLithuaniaLow & middle incomeLow incomeLower middle incomeLuxembourgMacao SAR, ChinaMacedonia, FYRMadagascarMalawiMalaysiaMaldivesMaliMaltaMarshall IslandsMauritaniaMauritiusMexicoMicronesia, Fed. Sts.Middle East & North AfricaMiddle East & North Africa (excluding high income)Middle East & North Africa (IDA & IBRD countries)Middle incomeMoldovaMongoliaMontenegroMoroccoMozambiqueMyanmarNamibiaNauruNepalNetherlandsNew CaledoniaNew ZealandNicaraguaNigerNigeriaNorth AmericaNorthern Mariana IslandsNorwayOECD membersOmanOther small statesPacific island small statesPakistanPalauPanamaPapua New GuineaParaguayPeruPhilippinesPolandPortugalPost-demographic dividendPre-demographic dividendPuerto RicoQatarRomaniaRussian FederationRwandaSamoaSan MarinoSao Tome and PrincipeSaudi ArabiaSenegalSerbiaSeychellesSierra LeoneSlovak RepublicSloveniaSmall statesSolomon IslandsSomaliaSouth AfricaSouth AsiaSouth Asia (IDA & IBRD)South SudanSpainSri LankaSt. Kitts and NevisSt. LuciaSt. Vincent and the GrenadinesSub-Saharan Africa Sub-Saharan Africa (excluding high income)Sub-Saharan Africa (IDA & IBRD countries)SudanSurinameSwazilandSwedenSwitzerlandSyrian Arab RepublicTajikistanTanzaniaThailandTimor-LesteTogoTongaTrinidad and TobagoTunisiaTurkeyTurkmenistanTurks and Caicos IslandsTuvaluUgandaUkraineUnited Arab EmiratesUnited KingdomUnited StatesUpper middle incomeUruguayUzbekistanVanuatuVenezuela, RBVietnamVirgin Islands (U.S.)West Bank and GazaWorldYemen, Rep.ZambiaZimbabwe Timeline:
This timeline shows a graph from 1961 to 2016 of Switzerland. No data until 1960. Number of actual observations by date: 56.
Source name:
World Development Indicators
Source organization:
World Bank Staff estimates based on United Nations, World Urbanization Prospects.
Categories, topics:
Agriculture & Rural Development
Last updated:
apr 23, 2017
Indicators value changes by year
Minimum:
-4.511
jan 1, 1990
At the date of observation
Value
Absolute change
Change from previous value
jan 1, 1961
0.808
+0.808
0.0%
jan 1, 1962
0.639
-0.169
-20.93%
jan 1, 1963
1.206
+0.568
88.88%
jan 1, 1964
0.793
-0.413
-34.25%
jan 1, 1965
0.291
-0.502
-63.27%
jan 1, 1966
-0.22
-0.512
-175.69%
jan 1, 1967
-0.349
-0.129
58.47%
jan 1, 1968
-0.171
+0.179
-51.15%
jan 1, 1969
-0.168
+0.002
-1.37%
jan 1, 1970
-0.316
-0.148
87.68%
jan 1, 1971
-0.735
-0.419
132.76%
jan 1, 1972
-0.014
+0.722
-98.13%
jan 1, 1973
0.897
+0.911
-6.61K%
jan 1, 1974
0.872
-0.024
-2.72%
jan 1, 1975
0.672
-0.2
-22.91%
jan 1, 1976
0.09
-0.582
-86.61%
jan 1, 1977
-0.438
-0.528
-586.41%
jan 1, 1978
-0.206
+0.232
-53.06%
jan 1, 1979
0.142
+0.348
-169.18%
jan 1, 1980
0.334
+0.192
134.8%
jan 1, 1981
0.53
+0.196
58.71%
jan 1, 1982
-1.897
-2.427
-457.86%
jan 1, 1983
-3.854
-1.957
103.19%
jan 1, 1984
-4.142
-0.288
7.48%
jan 1, 1985
-4.351
-0.209
5.05%
jan 1, 1986
-4.387
-0.035
0.82%
jan 1, 1987
-4.444
-0.057
1.31%
jan 1, 1988
-4.459
-0.015
0.33%
jan 1, 1989
-4.484
-0.025
0.57%
jan 1, 1990
-4.511
-0.027
0.59%
jan 1, 1991
-4.416
+0.095
-2.1%
jan 1, 1992
-1.002
+3.414
-77.32%
jan 1, 1993
1.297
+2.299
-229.47%
jan 1, 1994
1.105
-0.192
-14.82%
jan 1, 1995
0.987
-0.118
-10.66%
jan 1, 1996
0.861
-0.126
-12.72%
jan 1, 1997
0.634
-0.227
-26.34%
jan 1, 1998
0.433
-0.201
-31.71%
jan 1, 1999
0.493
+0.06
13.78%
jan 1, 2000
0.669
+0.176
35.61%
jan 1, 2001
0.753
+0.085
12.67%
jan 1, 2002
0.633
-0.121
-16.0%
jan 1, 2003
0.614
-0.019
-2.97%
jan 1, 2004
0.599
-0.015
-2.4%
jan 1, 2005
0.544
-0.055
-9.13%
jan 1, 2006
0.497
-0.047
-8.64%
jan 1, 2007
0.484
-0.013
-2.67%
jan 1, 2008
0.75
+0.266
54.93%
jan 1, 2009
1.127
+0.377
50.22%
jan 1, 2010
1.109
-0.018
-1.56%
jan 1, 2011
0.897
-0.212
-19.1%
jan 1, 2012
0.968
+0.07
7.82%
jan 1, 2013
0.917
-0.05
-5.2%
jan 1, 2014
0.967
+0.05
5.42%
jan 1, 2015
1.002
+0.036
3.67%
jan 1, 2016
0.933
-0.069
-6.9%
Ranking of countries by current statistics by years


Comments: