29
/
en
AIzaSyAYiBZKx7MnpbEhh9jyipgxe19OcubqV5w
April 1, 2024
159864
Ireland
IRL
true
2
1
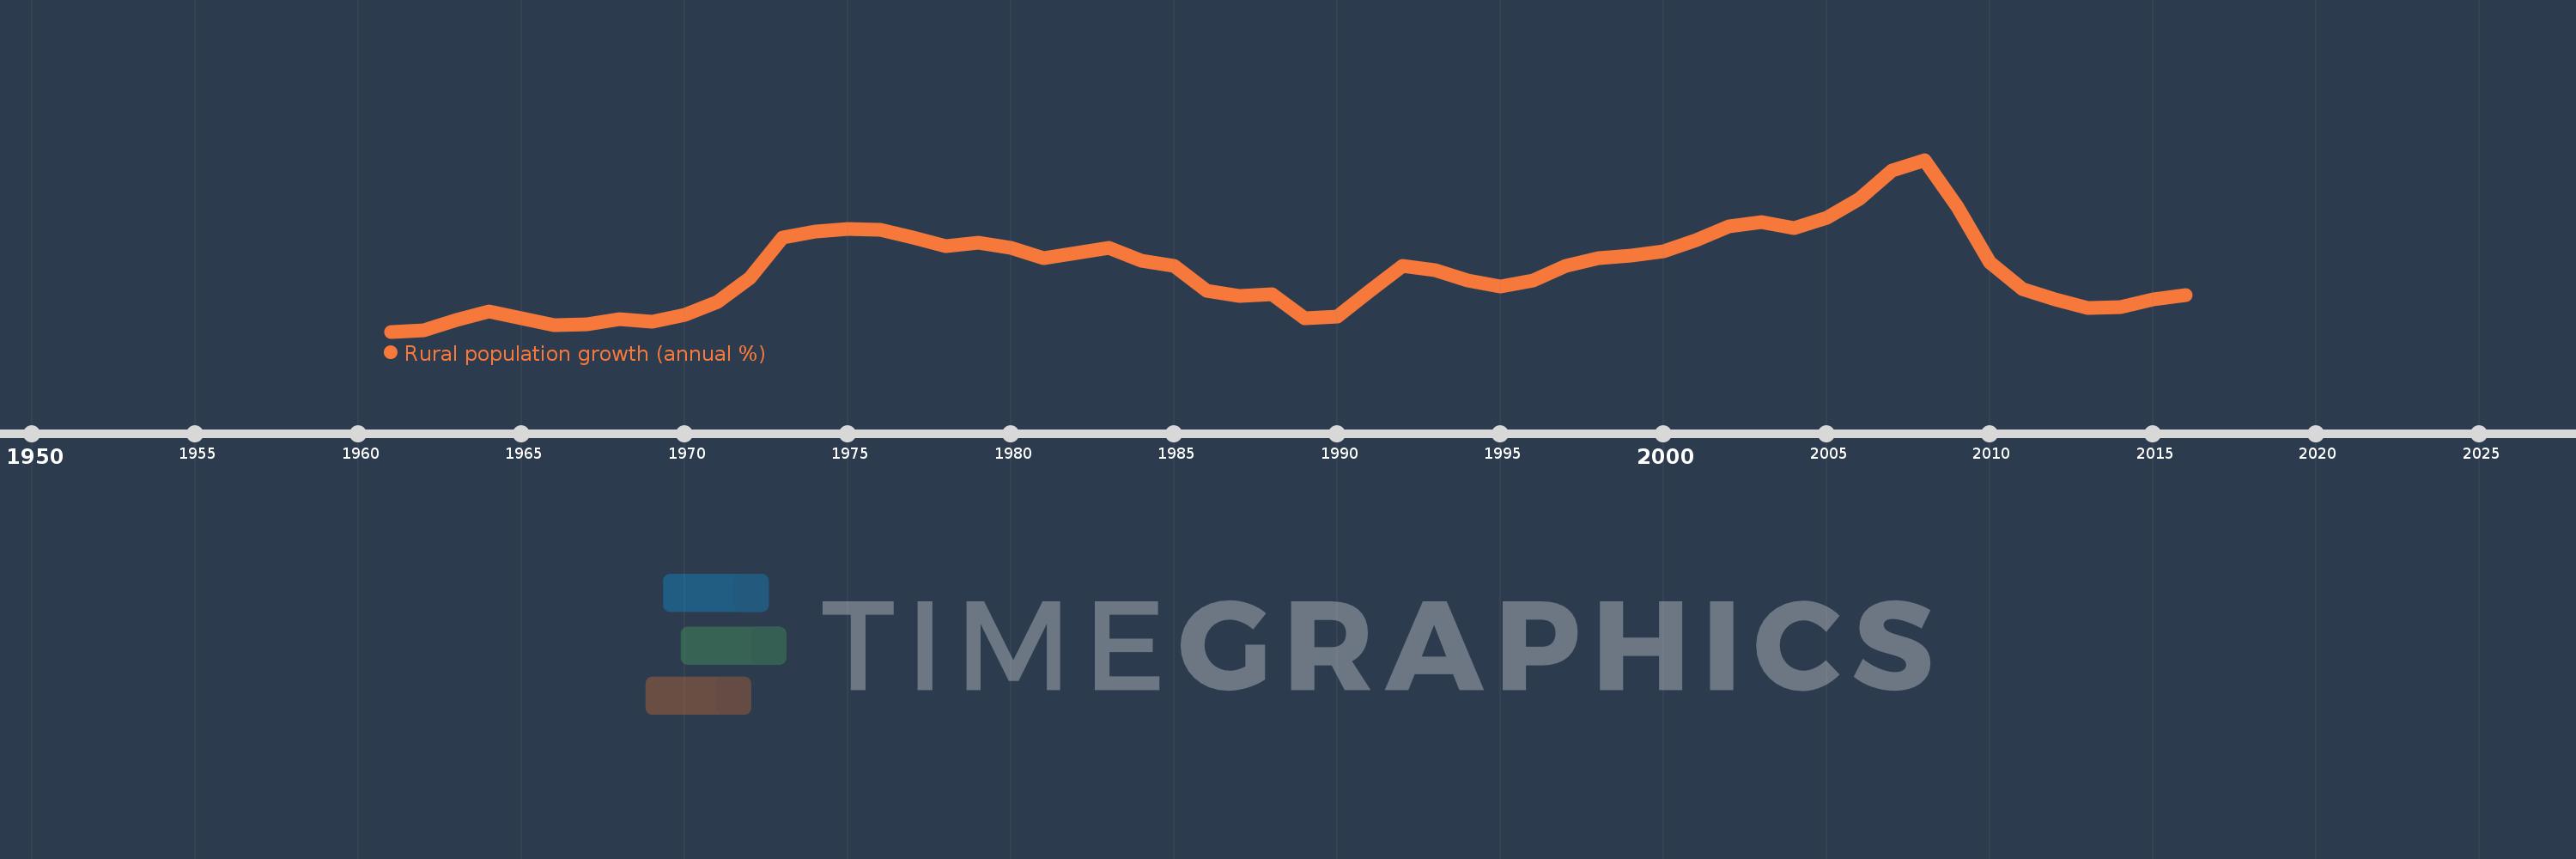
Rural population growth (annual %)
2016,2015,2014,2013,2012,2011,2010,2009,2008,2007,2006,2005,2004,2003,2002,2001,2000,1999,1998,1997,1996,1995,1994,1993,1992,1991,1990,1989,1988,1987,1986,1985,1984,1983,1982,1981,1980,1979,1978,1977,1976,1975,1974,1973,1972,1971,1970,1969,1968,1967,1966,1965,1964,1963,1962,1961
This statistics in other country:
AfghanistanAlbaniaAlgeriaAmerican SamoaAndorraAngolaAntigua and BarbudaArab WorldArgentinaArmeniaArubaAustraliaAustriaAzerbaijanBahamas, TheBahrainBangladeshBarbadosBelarusBelgiumBelizeBeninBhutanBoliviaBosnia and HerzegovinaBotswanaBrazilBritish Virgin IslandsBrunei DarussalamBulgariaBurkina FasoBurundiCabo VerdeCambodiaCameroonCanadaCaribbean small statesCentral African RepublicCentral Europe and the BalticsChadChannel IslandsChileChinaColombiaComorosCongo, Dem. Rep.Congo, Rep.Costa RicaCote d'IvoireCroatiaCubaCuracaoCyprusCzech RepublicDenmarkDjiboutiDominicaDominican RepublicEarly-demographic dividendEast Asia & PacificEast Asia & Pacific (excluding high income)East Asia & Pacific (IDA & IBRD countries)EcuadorEgypt, Arab Rep.El SalvadorEquatorial GuineaEritreaEstoniaEthiopiaEuro areaEurope & Central AsiaEurope & Central Asia (excluding high income)Europe & Central Asia (IDA & IBRD countries)European UnionFaroe IslandsFijiFinlandFragile and conflict affected situationsFranceFrench PolynesiaGabonGambia, TheGeorgiaGermanyGhanaGreeceGreenlandGrenadaGuamGuatemalaGuineaGuinea-BissauGuyanaHaitiHeavily indebted poor countries (HIPC)High incomeHondurasHong Kong SAR, ChinaHungaryIBRD onlyIcelandIDA & IBRD totalIDA blendIDA onlyIDA totalIndiaIndonesiaIran, Islamic Rep.IraqIrelandIsle of ManIsraelItalyJamaicaJapanJordanKazakhstanKenyaKiribatiKorea, Dem. People’s Rep.Korea, Rep.KuwaitKyrgyz RepublicLao PDRLate-demographic dividendLatin America & Caribbean Latin America & Caribbean (excluding high income)Latin America & the Caribbean (IDA & IBRD countries)LatviaLeast developed countries: UN classificationLebanonLesothoLiberiaLibyaLiechtensteinLithuaniaLow & middle incomeLow incomeLower middle incomeLuxembourgMacao SAR, ChinaMacedonia, FYRMadagascarMalawiMalaysiaMaldivesMaliMaltaMarshall IslandsMauritaniaMauritiusMexicoMicronesia, Fed. Sts.Middle East & North AfricaMiddle East & North Africa (excluding high income)Middle East & North Africa (IDA & IBRD countries)Middle incomeMoldovaMongoliaMontenegroMoroccoMozambiqueMyanmarNamibiaNauruNepalNetherlandsNew CaledoniaNew ZealandNicaraguaNigerNigeriaNorth AmericaNorthern Mariana IslandsNorwayOECD membersOmanOther small statesPacific island small statesPakistanPalauPanamaPapua New GuineaParaguayPeruPhilippinesPolandPortugalPost-demographic dividendPre-demographic dividendPuerto RicoQatarRomaniaRussian FederationRwandaSamoaSan MarinoSao Tome and PrincipeSaudi ArabiaSenegalSerbiaSeychellesSierra LeoneSlovak RepublicSloveniaSmall statesSolomon IslandsSomaliaSouth AfricaSouth AsiaSouth Asia (IDA & IBRD)South SudanSpainSri LankaSt. Kitts and NevisSt. LuciaSt. Vincent and the GrenadinesSub-Saharan Africa Sub-Saharan Africa (excluding high income)Sub-Saharan Africa (IDA & IBRD countries)SudanSurinameSwazilandSwedenSwitzerlandSyrian Arab RepublicTajikistanTanzaniaThailandTimor-LesteTogoTongaTrinidad and TobagoTunisiaTurkeyTurkmenistanTurks and Caicos IslandsTuvaluUgandaUkraineUnited Arab EmiratesUnited KingdomUnited StatesUpper middle incomeUruguayUzbekistanVanuatuVenezuela, RBVietnamVirgin Islands (U.S.)West Bank and GazaWorldYemen, Rep.ZambiaZimbabwe Timeline:
This timeline shows a graph from 1961 to 2016 of Ireland. No data until 1960. Number of actual observations by date: 56.
Source name:
World Development Indicators
Source organization:
World Bank Staff estimates based on United Nations, World Urbanization Prospects.
Categories, topics:
Agriculture & Rural Development
Last updated:
apr 23, 2017
Indicators value changes by year
Minimum:
-0.945
jan 1, 1961
At the date of observation
Value
Absolute change
Change from previous value
jan 1, 1961
-0.945
-0.945
0.0%
jan 1, 1962
-0.923
+0.022
-2.29%
jan 1, 1963
-0.741
+0.182
-19.75%
jan 1, 1964
-0.584
+0.157
-21.14%
jan 1, 1965
-0.697
-0.113
19.39%
jan 1, 1966
-0.823
-0.126
18.05%
jan 1, 1967
-0.805
+0.018
-2.17%
jan 1, 1968
-0.72
+0.086
-10.66%
jan 1, 1969
-0.757
-0.037
5.2%
jan 1, 1970
-0.633
+0.124
-16.34%
jan 1, 1971
-0.398
+0.236
-37.2%
jan 1, 1972
0.03
+0.428
-107.64%
jan 1, 1973
0.767
+0.737
2.42K%
jan 1, 1974
0.882
+0.115
14.93%
jan 1, 1975
0.927
+0.045
5.15%
jan 1, 1976
0.915
-0.012
-1.33%
jan 1, 1977
0.771
-0.144
-15.71%
jan 1, 1978
0.613
-0.158
-20.52%
jan 1, 1979
0.672
+0.059
9.63%
jan 1, 1980
0.582
-0.09
-13.38%
jan 1, 1981
0.395
-0.187
-32.17%
jan 1, 1982
0.495
+0.1
25.39%
jan 1, 1983
0.584
+0.089
18.03%
jan 1, 1984
0.344
-0.24
-41.1%
jan 1, 1985
0.256
-0.088
-25.66%
jan 1, 1986
-0.205
-0.461
-180.23%
jan 1, 1987
-0.3
-0.095
46.4%
jan 1, 1988
-0.265
+0.035
-11.64%
jan 1, 1989
-0.704
-0.439
165.28%
jan 1, 1990
-0.674
+0.031
-4.35%
jan 1, 1991
-0.194
+0.48
-71.25%
jan 1, 1992
0.25
+0.443
-228.86%
jan 1, 1993
0.171
-0.078
-31.42%
jan 1, 1994
-0.014
-0.185
-108.15%
jan 1, 1995
-0.12
-0.106
760.01%
jan 1, 1996
-0.004
+0.116
-96.65%
jan 1, 1997
0.258
+0.262
-6.51K%
jan 1, 1998
0.401
+0.144
55.84%
jan 1, 1999
0.44
+0.039
9.71%
jan 1, 2000
0.519
+0.078
17.76%
jan 1, 2001
0.723
+0.204
39.43%
jan 1, 2002
0.981
+0.258
35.65%
jan 1, 2003
1.058
+0.077
7.84%
jan 1, 2004
0.943
-0.115
-10.88%
jan 1, 2005
1.135
+0.192
20.38%
jan 1, 2006
1.485
+0.351
30.9%
jan 1, 2007
1.998
+0.512
34.5%
jan 1, 2008
2.193
+0.195
9.77%
jan 1, 2009
1.336
-0.857
-39.09%
jan 1, 2010
0.313
-1.023
-76.57%
jan 1, 2011
-0.163
-0.476
-152.01%
jan 1, 2012
-0.349
-0.186
114.09%
jan 1, 2013
-0.508
-0.159
45.75%
jan 1, 2014
-0.502
+0.006
-1.23%
jan 1, 2015
-0.355
+0.146
-29.15%
jan 1, 2016
-0.276
+0.079
-22.36%
Ranking of countries by current statistics by years


Comments: