29
/
en
AIzaSyAYiBZKx7MnpbEhh9jyipgxe19OcubqV5w
April 1, 2024
204704
Myanmar
MMR
true
2
1
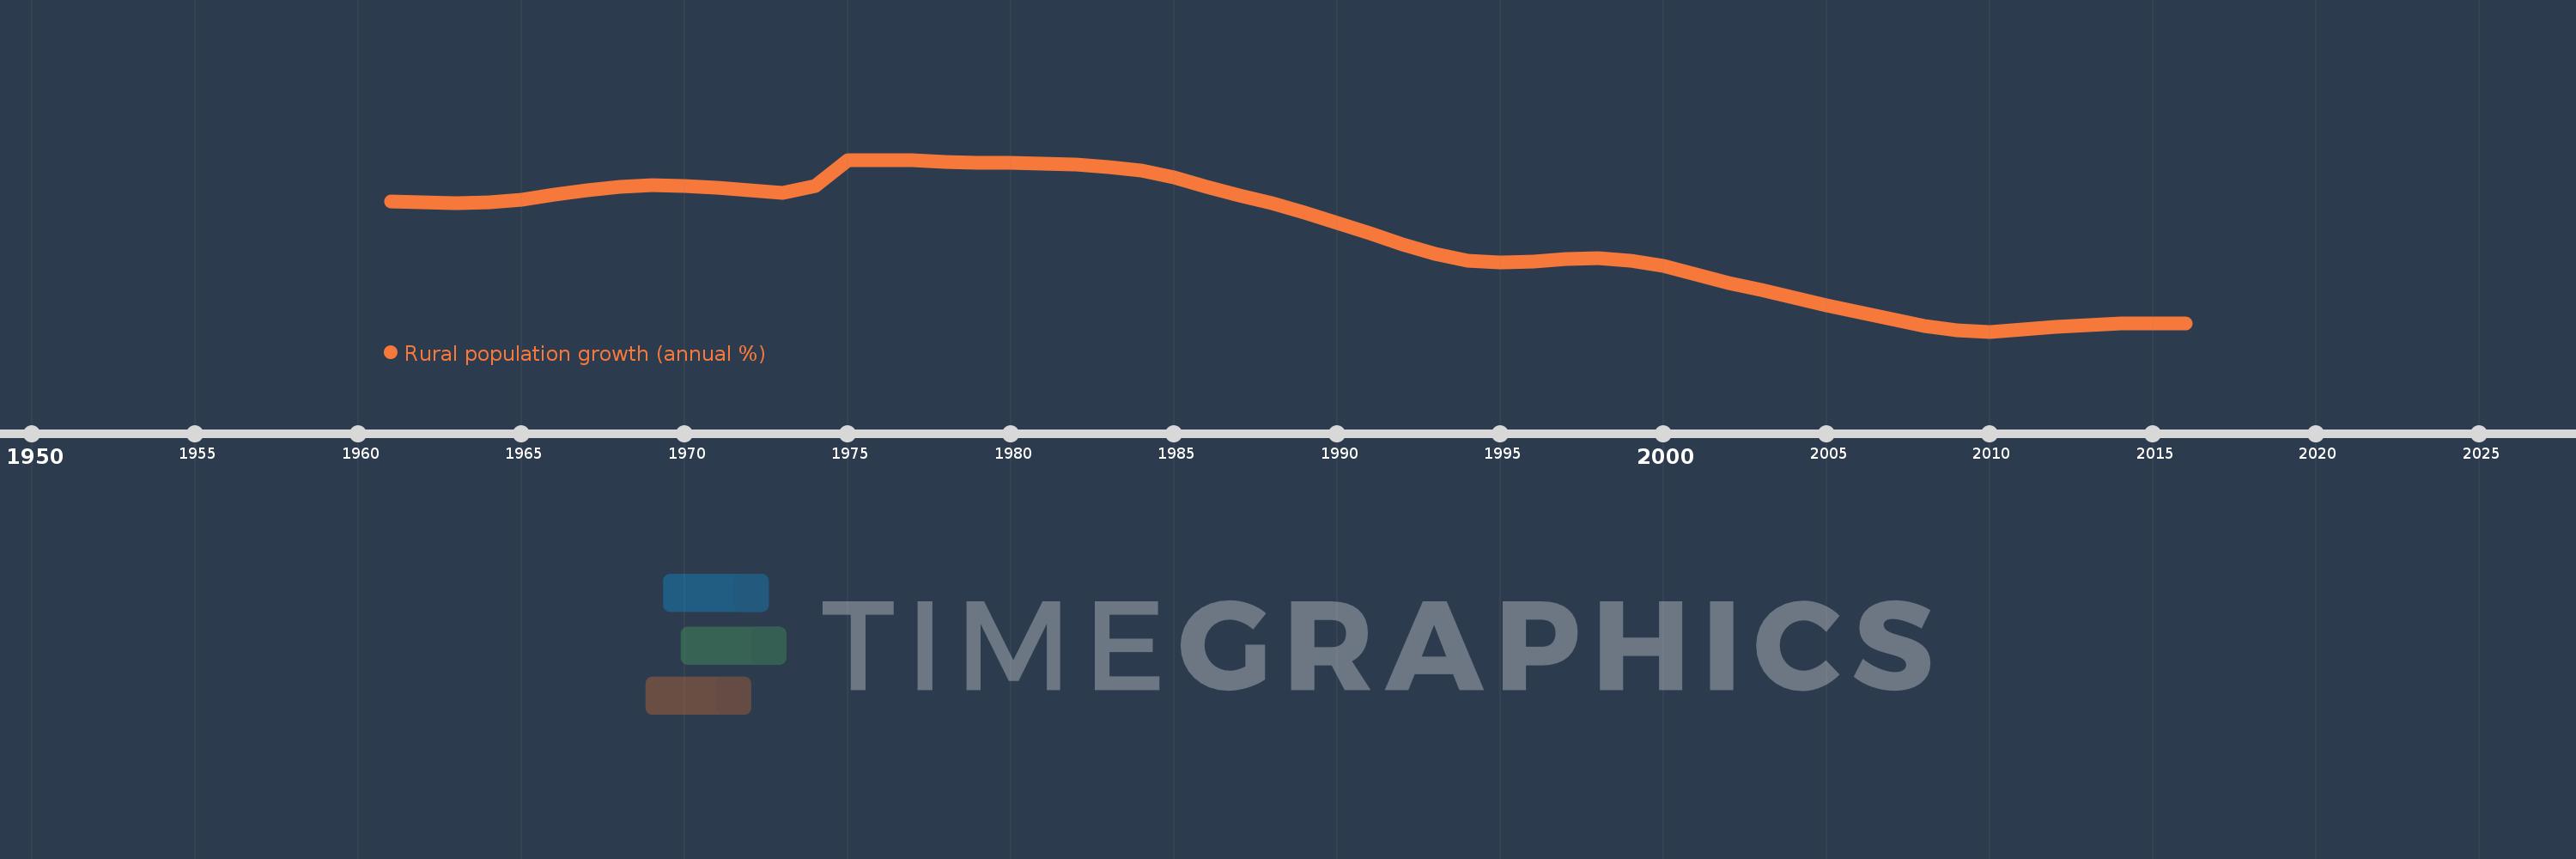
Rural population growth (annual %)
2016,2015,2014,2013,2012,2011,2010,2009,2008,2007,2006,2005,2004,2003,2002,2001,2000,1999,1998,1997,1996,1995,1994,1993,1992,1991,1990,1989,1988,1987,1986,1985,1984,1983,1982,1981,1980,1979,1978,1977,1976,1975,1974,1973,1972,1971,1970,1969,1968,1967,1966,1965,1964,1963,1962,1961
This statistics in other country:
AfghanistanAlbaniaAlgeriaAmerican SamoaAndorraAngolaAntigua and BarbudaArab WorldArgentinaArmeniaArubaAustraliaAustriaAzerbaijanBahamas, TheBahrainBangladeshBarbadosBelarusBelgiumBelizeBeninBhutanBoliviaBosnia and HerzegovinaBotswanaBrazilBritish Virgin IslandsBrunei DarussalamBulgariaBurkina FasoBurundiCabo VerdeCambodiaCameroonCanadaCaribbean small statesCentral African RepublicCentral Europe and the BalticsChadChannel IslandsChileChinaColombiaComorosCongo, Dem. Rep.Congo, Rep.Costa RicaCote d'IvoireCroatiaCubaCuracaoCyprusCzech RepublicDenmarkDjiboutiDominicaDominican RepublicEarly-demographic dividendEast Asia & PacificEast Asia & Pacific (excluding high income)East Asia & Pacific (IDA & IBRD countries)EcuadorEgypt, Arab Rep.El SalvadorEquatorial GuineaEritreaEstoniaEthiopiaEuro areaEurope & Central AsiaEurope & Central Asia (excluding high income)Europe & Central Asia (IDA & IBRD countries)European UnionFaroe IslandsFijiFinlandFragile and conflict affected situationsFranceFrench PolynesiaGabonGambia, TheGeorgiaGermanyGhanaGreeceGreenlandGrenadaGuamGuatemalaGuineaGuinea-BissauGuyanaHaitiHeavily indebted poor countries (HIPC)High incomeHondurasHong Kong SAR, ChinaHungaryIBRD onlyIcelandIDA & IBRD totalIDA blendIDA onlyIDA totalIndiaIndonesiaIran, Islamic Rep.IraqIrelandIsle of ManIsraelItalyJamaicaJapanJordanKazakhstanKenyaKiribatiKorea, Dem. People’s Rep.Korea, Rep.KuwaitKyrgyz RepublicLao PDRLate-demographic dividendLatin America & Caribbean Latin America & Caribbean (excluding high income)Latin America & the Caribbean (IDA & IBRD countries)LatviaLeast developed countries: UN classificationLebanonLesothoLiberiaLibyaLiechtensteinLithuaniaLow & middle incomeLow incomeLower middle incomeLuxembourgMacao SAR, ChinaMacedonia, FYRMadagascarMalawiMalaysiaMaldivesMaliMaltaMarshall IslandsMauritaniaMauritiusMexicoMicronesia, Fed. Sts.Middle East & North AfricaMiddle East & North Africa (excluding high income)Middle East & North Africa (IDA & IBRD countries)Middle incomeMoldovaMongoliaMontenegroMoroccoMozambiqueMyanmarNamibiaNauruNepalNetherlandsNew CaledoniaNew ZealandNicaraguaNigerNigeriaNorth AmericaNorthern Mariana IslandsNorwayOECD membersOmanOther small statesPacific island small statesPakistanPalauPanamaPapua New GuineaParaguayPeruPhilippinesPolandPortugalPost-demographic dividendPre-demographic dividendPuerto RicoQatarRomaniaRussian FederationRwandaSamoaSan MarinoSao Tome and PrincipeSaudi ArabiaSenegalSerbiaSeychellesSierra LeoneSlovak RepublicSloveniaSmall statesSolomon IslandsSomaliaSouth AfricaSouth AsiaSouth Asia (IDA & IBRD)South SudanSpainSri LankaSt. Kitts and NevisSt. LuciaSt. Vincent and the GrenadinesSub-Saharan Africa Sub-Saharan Africa (excluding high income)Sub-Saharan Africa (IDA & IBRD countries)SudanSurinameSwazilandSwedenSwitzerlandSyrian Arab RepublicTajikistanTanzaniaThailandTimor-LesteTogoTongaTrinidad and TobagoTunisiaTurkeyTurkmenistanTurks and Caicos IslandsTuvaluUgandaUkraineUnited Arab EmiratesUnited KingdomUnited StatesUpper middle incomeUruguayUzbekistanVanuatuVenezuela, RBVietnamVirgin Islands (U.S.)West Bank and GazaWorldYemen, Rep.ZambiaZimbabwe Timeline:
This timeline shows a graph from 1961 to 2016 of Myanmar. No data until 1960. Number of actual observations by date: 56.
Source name:
World Development Indicators
Source organization:
World Bank Staff estimates based on United Nations, World Urbanization Prospects.
Categories, topics:
Agriculture & Rural Development
Last updated:
apr 23, 2017
Indicators value changes by year
Minimum:
-0.083
jan 1, 2010
At the date of observation
Value
Absolute change
Change from previous value
jan 1, 1961
1.782
+1.782
0.0%
jan 1, 1962
1.766
-0.017
-0.94%
jan 1, 1963
1.756
-0.009
-0.53%
jan 1, 1964
1.769
+0.013
0.73%
jan 1, 1965
1.812
+0.043
2.45%
jan 1, 1966
1.875
+0.062
3.43%
jan 1, 1967
1.938
+0.064
3.4%
jan 1, 1968
1.987
+0.049
2.52%
jan 1, 1969
2.01
+0.023
1.16%
jan 1, 1970
2.003
-0.007
-0.34%
jan 1, 1971
1.974
-0.029
-1.47%
jan 1, 1972
1.938
-0.035
-1.79%
jan 1, 1973
1.905
-0.033
-1.71%
jan 1, 1974
2.009
+0.104
5.47%
jan 1, 1975
2.379
+0.369
18.39%
jan 1, 1976
2.379
0.0
-0.01%
jan 1, 1977
2.368
-0.011
-0.47%
jan 1, 1978
2.354
-0.013
-0.56%
jan 1, 1979
2.34
-0.015
-0.62%
jan 1, 1980
2.331
-0.009
-0.4%
jan 1, 1981
2.318
-0.012
-0.52%
jan 1, 1982
2.309
-0.01
-0.43%
jan 1, 1983
2.28
-0.028
-1.22%
jan 1, 1984
2.23
-0.05
-2.19%
jan 1, 1985
2.126
-0.105
-4.69%
jan 1, 1986
1.997
-0.129
-6.06%
jan 1, 1987
1.872
-0.125
-6.25%
jan 1, 1988
1.752
-0.12
-6.42%
jan 1, 1989
1.618
-0.134
-7.64%
jan 1, 1990
1.474
-0.144
-8.91%
jan 1, 1991
1.327
-0.147
-9.99%
jan 1, 1992
1.169
-0.158
-11.92%
jan 1, 1993
1.027
-0.141
-12.1%
jan 1, 1994
0.936
-0.091
-8.85%
jan 1, 1995
0.908
-0.028
-3.03%
jan 1, 1996
0.924
+0.016
1.73%
jan 1, 1997
0.955
+0.032
3.43%
jan 1, 1998
0.964
+0.009
0.93%
jan 1, 1999
0.938
-0.026
-2.72%
jan 1, 2000
0.856
-0.082
-8.75%
jan 1, 2001
0.738
-0.118
-13.73%
jan 1, 2002
0.617
-0.122
-16.46%
jan 1, 2003
0.509
-0.108
-17.54%
jan 1, 2004
0.401
-0.108
-21.19%
jan 1, 2005
0.295
-0.106
-26.32%
jan 1, 2006
0.197
-0.098
-33.23%
jan 1, 2007
0.096
-0.102
-51.57%
jan 1, 2008
-0.001
-0.097
-101.36%
jan 1, 2009
-0.061
-0.06
4.64K%
jan 1, 2010
-0.083
-0.022
35.24%
jan 1, 2011
-0.056
+0.027
-32.28%
jan 1, 2012
-0.02
+0.036
-64.46%
jan 1, 2013
0.012
+0.032
-159.45%
jan 1, 2014
0.034
+0.022
186.1%
jan 1, 2015
0.037
+0.003
7.62%
jan 1, 2016
0.031
-0.006
-16.62%
Ranking of countries by current statistics by years


Comments: