29
/
en
AIzaSyAYiBZKx7MnpbEhh9jyipgxe19OcubqV5w
April 1, 2024
172183
Kuwait
KWT
true
2
1
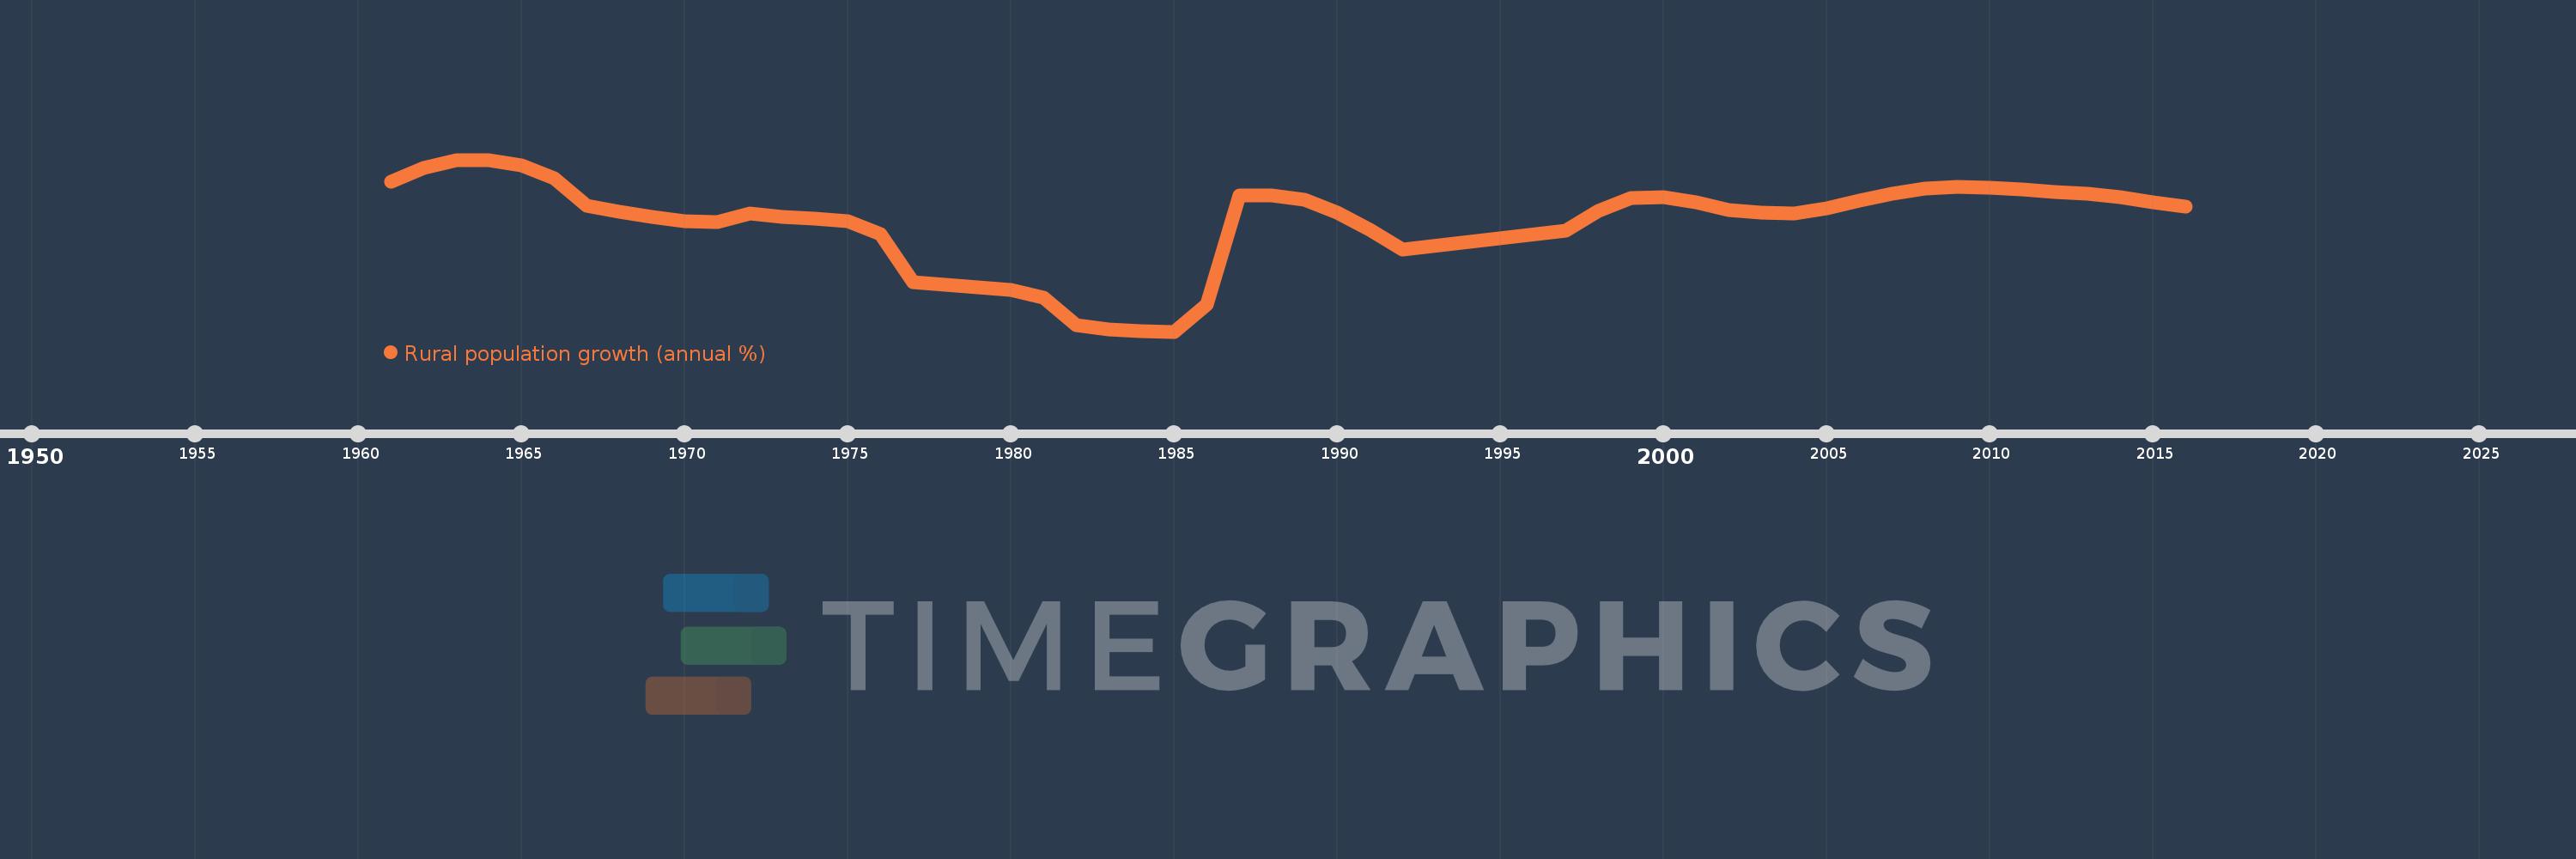
Rural population growth (annual %)
2016,2015,2014,2013,2012,2011,2010,2009,2008,2007,2006,2005,2004,2003,2002,2001,2000,1999,1998,1997,1992,1991,1990,1989,1988,1987,1986,1985,1984,1983,1982,1981,1980,1979,1978,1977,1976,1975,1974,1973,1972,1971,1970,1969,1968,1967,1966,1965,1964,1963,1962,1961
This statistics in other country:
AfghanistanAlbaniaAlgeriaAmerican SamoaAndorraAngolaAntigua and BarbudaArab WorldArgentinaArmeniaArubaAustraliaAustriaAzerbaijanBahamas, TheBahrainBangladeshBarbadosBelarusBelgiumBelizeBeninBhutanBoliviaBosnia and HerzegovinaBotswanaBrazilBritish Virgin IslandsBrunei DarussalamBulgariaBurkina FasoBurundiCabo VerdeCambodiaCameroonCanadaCaribbean small statesCentral African RepublicCentral Europe and the BalticsChadChannel IslandsChileChinaColombiaComorosCongo, Dem. Rep.Congo, Rep.Costa RicaCote d'IvoireCroatiaCubaCuracaoCyprusCzech RepublicDenmarkDjiboutiDominicaDominican RepublicEarly-demographic dividendEast Asia & PacificEast Asia & Pacific (excluding high income)East Asia & Pacific (IDA & IBRD countries)EcuadorEgypt, Arab Rep.El SalvadorEquatorial GuineaEritreaEstoniaEthiopiaEuro areaEurope & Central AsiaEurope & Central Asia (excluding high income)Europe & Central Asia (IDA & IBRD countries)European UnionFaroe IslandsFijiFinlandFragile and conflict affected situationsFranceFrench PolynesiaGabonGambia, TheGeorgiaGermanyGhanaGreeceGreenlandGrenadaGuamGuatemalaGuineaGuinea-BissauGuyanaHaitiHeavily indebted poor countries (HIPC)High incomeHondurasHong Kong SAR, ChinaHungaryIBRD onlyIcelandIDA & IBRD totalIDA blendIDA onlyIDA totalIndiaIndonesiaIran, Islamic Rep.IraqIrelandIsle of ManIsraelItalyJamaicaJapanJordanKazakhstanKenyaKiribatiKorea, Dem. People’s Rep.Korea, Rep.KuwaitKyrgyz RepublicLao PDRLate-demographic dividendLatin America & Caribbean Latin America & Caribbean (excluding high income)Latin America & the Caribbean (IDA & IBRD countries)LatviaLeast developed countries: UN classificationLebanonLesothoLiberiaLibyaLiechtensteinLithuaniaLow & middle incomeLow incomeLower middle incomeLuxembourgMacao SAR, ChinaMacedonia, FYRMadagascarMalawiMalaysiaMaldivesMaliMaltaMarshall IslandsMauritaniaMauritiusMexicoMicronesia, Fed. Sts.Middle East & North AfricaMiddle East & North Africa (excluding high income)Middle East & North Africa (IDA & IBRD countries)Middle incomeMoldovaMongoliaMontenegroMoroccoMozambiqueMyanmarNamibiaNauruNepalNetherlandsNew CaledoniaNew ZealandNicaraguaNigerNigeriaNorth AmericaNorthern Mariana IslandsNorwayOECD membersOmanOther small statesPacific island small statesPakistanPalauPanamaPapua New GuineaParaguayPeruPhilippinesPolandPortugalPost-demographic dividendPre-demographic dividendPuerto RicoQatarRomaniaRussian FederationRwandaSamoaSan MarinoSao Tome and PrincipeSaudi ArabiaSenegalSerbiaSeychellesSierra LeoneSlovak RepublicSloveniaSmall statesSolomon IslandsSomaliaSouth AfricaSouth AsiaSouth Asia (IDA & IBRD)South SudanSpainSri LankaSt. Kitts and NevisSt. LuciaSt. Vincent and the GrenadinesSub-Saharan Africa Sub-Saharan Africa (excluding high income)Sub-Saharan Africa (IDA & IBRD countries)SudanSurinameSwazilandSwedenSwitzerlandSyrian Arab RepublicTajikistanTanzaniaThailandTimor-LesteTogoTongaTrinidad and TobagoTunisiaTurkeyTurkmenistanTurks and Caicos IslandsTuvaluUgandaUkraineUnited Arab EmiratesUnited KingdomUnited StatesUpper middle incomeUruguayUzbekistanVanuatuVenezuela, RBVietnamVirgin Islands (U.S.)West Bank and GazaWorldYemen, Rep.ZambiaZimbabwe Timeline:
This timeline shows a graph from 1961 to 2016 of Kuwait. No data until 1960. Number of actual observations by date: 52.
Source name:
World Development Indicators
Source organization:
World Bank Staff estimates based on United Nations, World Urbanization Prospects.
Categories, topics:
Agriculture & Rural Development
Last updated:
apr 23, 2017
Indicators value changes by year
Minimum:
-14.733
jan 1, 1985
At the date of observation
Value
Absolute change
Change from previous value
jan 1, 1961
6.205
+6.205
0.0%
jan 1, 1962
8.129
+1.924
31.01%
jan 1, 1963
9.214
+1.085
13.35%
jan 1, 1964
9.279
+0.065
0.7%
jan 1, 1965
8.481
-0.798
-8.6%
jan 1, 1966
6.736
-1.745
-20.58%
jan 1, 1967
2.903
-3.833
-56.9%
jan 1, 1968
2.012
-0.891
-30.7%
jan 1, 1969
1.243
-0.769
-38.22%
jan 1, 1970
0.651
-0.592
-47.64%
jan 1, 1971
0.547
-0.104
-15.92%
jan 1, 1972
1.797
+1.249
228.32%
jan 1, 1973
1.355
-0.442
-24.58%
jan 1, 1974
0.998
-0.357
-26.37%
jan 1, 1975
0.661
-0.336
-33.71%
jan 1, 1976
-1.137
-1.798
-271.91%
jan 1, 1977
-7.785
-6.648
584.73%
jan 1, 1978
-8.171
-0.386
4.96%
jan 1, 1979
-8.559
-0.388
4.75%
jan 1, 1980
-8.928
-0.369
4.31%
jan 1, 1981
-10.032
-1.104
12.37%
jan 1, 1982
-13.876
-3.844
38.32%
jan 1, 1983
-14.378
-0.502
3.61%
jan 1, 1984
-14.643
-0.265
1.84%
jan 1, 1985
-14.733
-0.09
0.61%
jan 1, 1986
-10.952
+3.781
-25.66%
jan 1, 1987
4.269
+15.221
-138.97%
jan 1, 1988
4.344
+0.075
1.76%
jan 1, 1989
3.642
-0.702
-16.17%
jan 1, 1990
1.871
-1.77
-48.61%
jan 1, 1991
-0.476
-2.347
-125.43%
jan 1, 1992
-3.238
-2.762
580.33%
jan 1, 1997
-0.664
+2.574
-79.5%
jan 1, 1998
2.185
+2.849
-429.09%
jan 1, 1999
3.907
+1.722
78.81%
jan 1, 2000
4.067
+0.16
4.1%
jan 1, 2001
3.297
-0.77
-18.92%
jan 1, 2002
2.292
-1.006
-30.5%
jan 1, 2003
1.838
-0.454
-19.8%
jan 1, 2004
1.789
-0.049
-2.65%
jan 1, 2005
2.485
+0.696
38.9%
jan 1, 2006
3.567
+1.082
43.53%
jan 1, 2007
4.582
+1.015
28.45%
jan 1, 2008
5.215
+0.633
13.83%
jan 1, 2009
5.516
+0.301
5.78%
jan 1, 2010
5.39
-0.126
-2.28%
jan 1, 2011
5.143
-0.248
-4.59%
jan 1, 2012
4.782
-0.361
-7.02%
jan 1, 2013
4.545
-0.237
-4.96%
jan 1, 2014
4.023
-0.521
-11.47%
jan 1, 2015
3.39
-0.634
-15.75%
jan 1, 2016
2.676
-0.714
-21.05%
Ranking of countries by current statistics by years


Comments: