29
/
en
AIzaSyAYiBZKx7MnpbEhh9jyipgxe19OcubqV5w
April 1, 2024
230399
Russian Federation
RUS
true
2
1
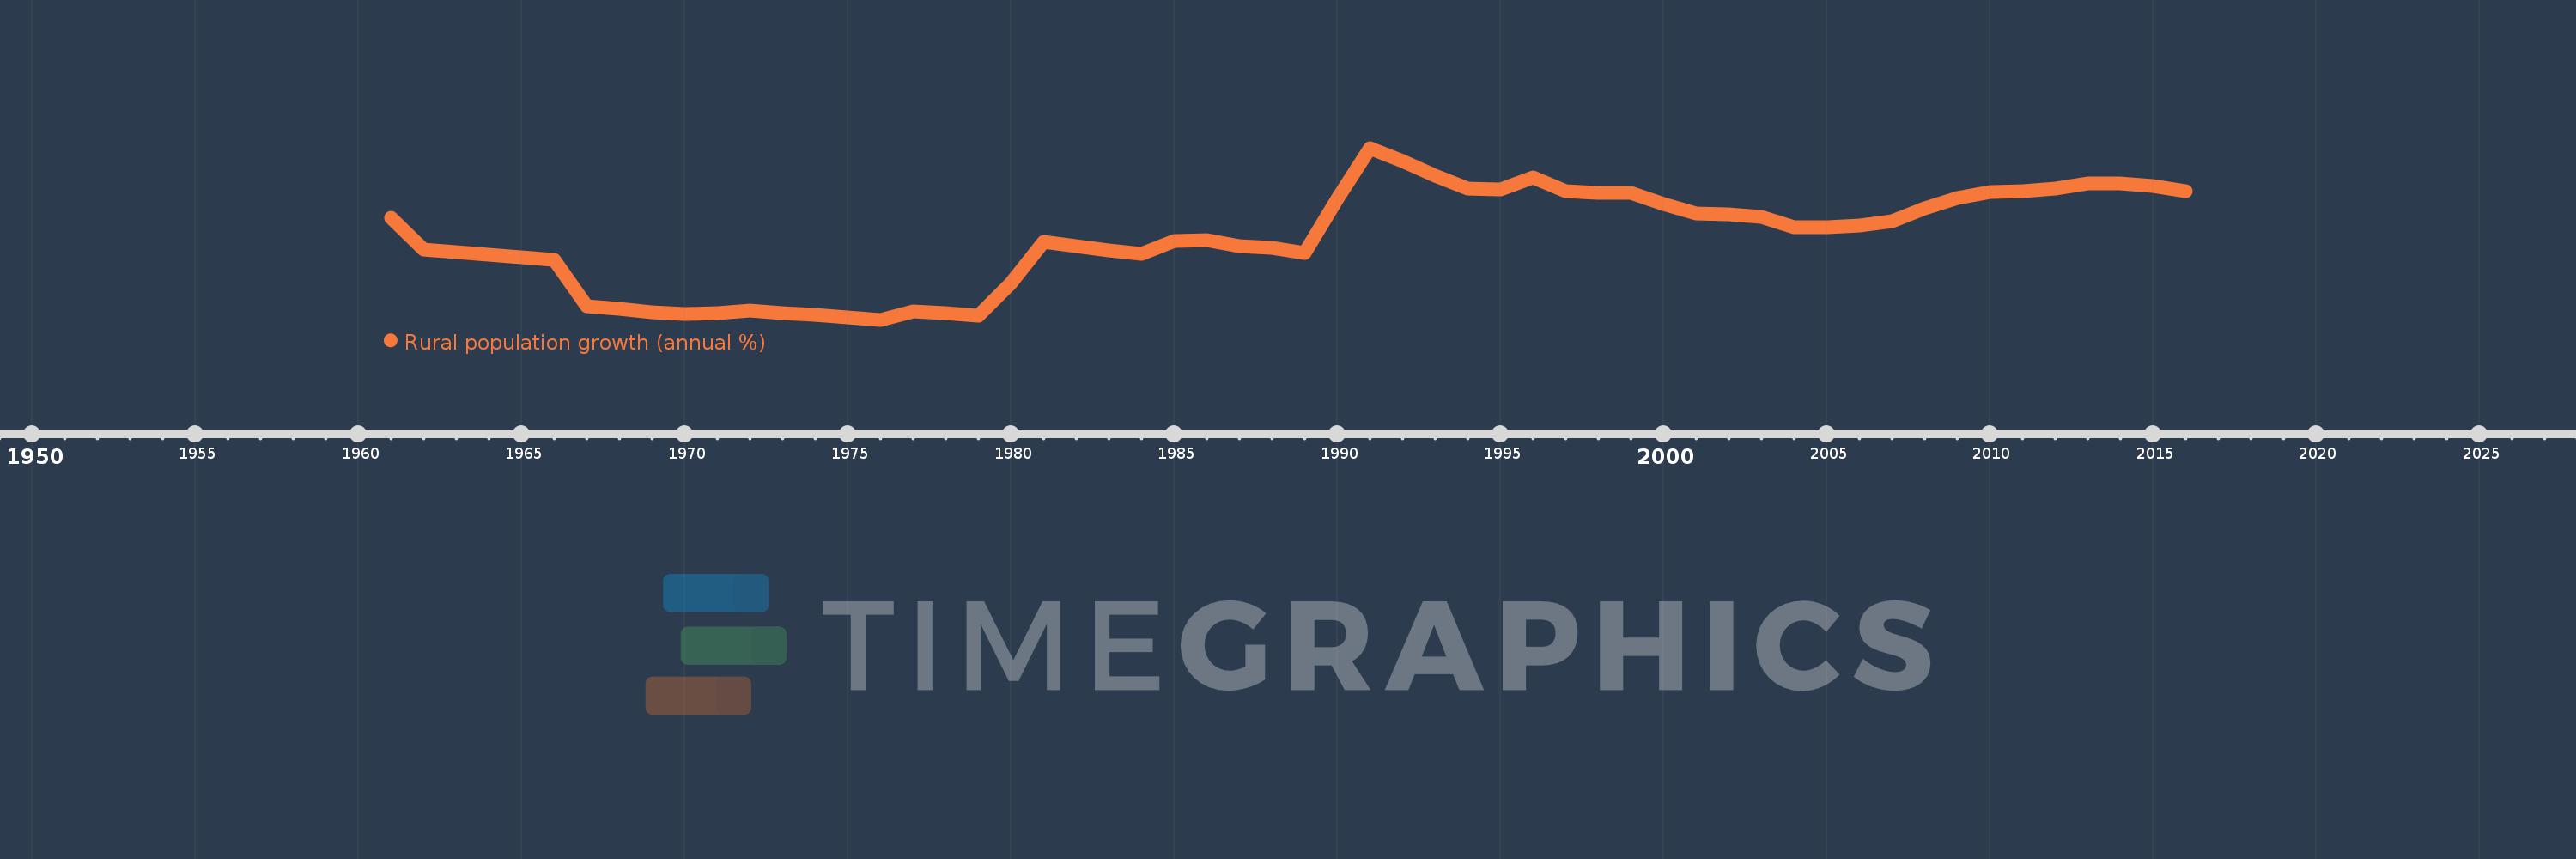
Rural population growth (annual %)
2016,2015,2014,2013,2012,2011,2010,2009,2008,2007,2006,2005,2004,2003,2002,2001,2000,1999,1998,1997,1996,1995,1994,1993,1992,1991,1990,1989,1988,1987,1986,1985,1984,1983,1982,1981,1980,1979,1978,1977,1976,1975,1974,1973,1972,1971,1970,1969,1968,1967,1966,1965,1964,1963,1962,1961
This statistics in other country:
AfghanistanAlbaniaAlgeriaAmerican SamoaAndorraAngolaAntigua and BarbudaArab WorldArgentinaArmeniaArubaAustraliaAustriaAzerbaijanBahamas, TheBahrainBangladeshBarbadosBelarusBelgiumBelizeBeninBhutanBoliviaBosnia and HerzegovinaBotswanaBrazilBritish Virgin IslandsBrunei DarussalamBulgariaBurkina FasoBurundiCabo VerdeCambodiaCameroonCanadaCaribbean small statesCentral African RepublicCentral Europe and the BalticsChadChannel IslandsChileChinaColombiaComorosCongo, Dem. Rep.Congo, Rep.Costa RicaCote d'IvoireCroatiaCubaCuracaoCyprusCzech RepublicDenmarkDjiboutiDominicaDominican RepublicEarly-demographic dividendEast Asia & PacificEast Asia & Pacific (excluding high income)East Asia & Pacific (IDA & IBRD countries)EcuadorEgypt, Arab Rep.El SalvadorEquatorial GuineaEritreaEstoniaEthiopiaEuro areaEurope & Central AsiaEurope & Central Asia (excluding high income)Europe & Central Asia (IDA & IBRD countries)European UnionFaroe IslandsFijiFinlandFragile and conflict affected situationsFranceFrench PolynesiaGabonGambia, TheGeorgiaGermanyGhanaGreeceGreenlandGrenadaGuamGuatemalaGuineaGuinea-BissauGuyanaHaitiHeavily indebted poor countries (HIPC)High incomeHondurasHong Kong SAR, ChinaHungaryIBRD onlyIcelandIDA & IBRD totalIDA blendIDA onlyIDA totalIndiaIndonesiaIran, Islamic Rep.IraqIrelandIsle of ManIsraelItalyJamaicaJapanJordanKazakhstanKenyaKiribatiKorea, Dem. People’s Rep.Korea, Rep.KuwaitKyrgyz RepublicLao PDRLate-demographic dividendLatin America & Caribbean Latin America & Caribbean (excluding high income)Latin America & the Caribbean (IDA & IBRD countries)LatviaLeast developed countries: UN classificationLebanonLesothoLiberiaLibyaLiechtensteinLithuaniaLow & middle incomeLow incomeLower middle incomeLuxembourgMacao SAR, ChinaMacedonia, FYRMadagascarMalawiMalaysiaMaldivesMaliMaltaMarshall IslandsMauritaniaMauritiusMexicoMicronesia, Fed. Sts.Middle East & North AfricaMiddle East & North Africa (excluding high income)Middle East & North Africa (IDA & IBRD countries)Middle incomeMoldovaMongoliaMontenegroMoroccoMozambiqueMyanmarNamibiaNauruNepalNetherlandsNew CaledoniaNew ZealandNicaraguaNigerNigeriaNorth AmericaNorthern Mariana IslandsNorwayOECD membersOmanOther small statesPacific island small statesPakistanPalauPanamaPapua New GuineaParaguayPeruPhilippinesPolandPortugalPost-demographic dividendPre-demographic dividendPuerto RicoQatarRomaniaRussian FederationRwandaSamoaSan MarinoSao Tome and PrincipeSaudi ArabiaSenegalSerbiaSeychellesSierra LeoneSlovak RepublicSloveniaSmall statesSolomon IslandsSomaliaSouth AfricaSouth AsiaSouth Asia (IDA & IBRD)South SudanSpainSri LankaSt. Kitts and NevisSt. LuciaSt. Vincent and the GrenadinesSub-Saharan Africa Sub-Saharan Africa (excluding high income)Sub-Saharan Africa (IDA & IBRD countries)SudanSurinameSwazilandSwedenSwitzerlandSyrian Arab RepublicTajikistanTanzaniaThailandTimor-LesteTogoTongaTrinidad and TobagoTunisiaTurkeyTurkmenistanTurks and Caicos IslandsTuvaluUgandaUkraineUnited Arab EmiratesUnited KingdomUnited StatesUpper middle incomeUruguayUzbekistanVanuatuVenezuela, RBVietnamVirgin Islands (U.S.)West Bank and GazaWorldYemen, Rep.ZambiaZimbabwe Timeline:
This timeline shows a graph from 1961 to 2016 of Russian Federation. No data until 1960. Number of actual observations by date: 56.
Source name:
World Development Indicators
Source organization:
World Bank Staff estimates based on United Nations, World Urbanization Prospects.
Categories, topics:
Agriculture & Rural Development
Last updated:
apr 23, 2017
Indicators value changes by year
Minimum:
-1.708
jan 1, 1976
At the date of observation
Value
Absolute change
Change from previous value
jan 1, 1961
-0.455
-0.455
0.0%
jan 1, 1962
-0.843
-0.388
85.27%
jan 1, 1963
-0.874
-0.031
3.72%
jan 1, 1964
-0.911
-0.037
4.18%
jan 1, 1965
-0.942
-0.032
3.49%
jan 1, 1966
-0.969
-0.027
2.83%
jan 1, 1967
-1.545
-0.576
59.47%
jan 1, 1968
-1.578
-0.033
2.1%
jan 1, 1969
-1.612
-0.034
2.19%
jan 1, 1970
-1.635
-0.023
1.41%
jan 1, 1971
-1.626
+0.009
-0.54%
jan 1, 1972
-1.6
+0.027
-1.64%
jan 1, 1973
-1.629
-0.03
1.86%
jan 1, 1974
-1.652
-0.023
1.4%
jan 1, 1975
-1.681
-0.028
1.72%
jan 1, 1976
-1.708
-0.028
1.65%
jan 1, 1977
-1.608
+0.1
-5.87%
jan 1, 1978
-1.629
-0.021
1.3%
jan 1, 1979
-1.659
-0.03
1.84%
jan 1, 1980
-1.255
+0.403
-24.33%
jan 1, 1981
-0.754
+0.501
-39.93%
jan 1, 1982
-0.804
-0.05
6.69%
jan 1, 1983
-0.852
-0.048
5.92%
jan 1, 1984
-0.894
-0.042
4.92%
jan 1, 1985
-0.743
+0.151
-16.84%
jan 1, 1986
-0.729
+0.014
-1.92%
jan 1, 1987
-0.8
-0.071
9.78%
jan 1, 1988
-0.829
-0.029
3.61%
jan 1, 1989
-0.891
-0.062
7.42%
jan 1, 1990
-0.226
+0.665
-74.65%
jan 1, 1991
0.401
+0.627
-277.5%
jan 1, 1992
0.242
-0.158
-39.52%
jan 1, 1993
0.059
-0.184
-75.76%
jan 1, 1994
-0.099
-0.157
-267.98%
jan 1, 1995
-0.105
-0.006
6.57%
jan 1, 1996
0.042
+0.147
-139.74%
jan 1, 1997
-0.127
-0.168
-403.1%
jan 1, 1998
-0.15
-0.024
18.64%
jan 1, 1999
-0.15
0.0
0.13%
jan 1, 2000
-0.291
-0.14
93.17%
jan 1, 2001
-0.406
-0.115
39.51%
jan 1, 2002
-0.409
-0.004
0.88%
jan 1, 2003
-0.441
-0.032
7.86%
jan 1, 2004
-0.574
-0.133
30.03%
jan 1, 2005
-0.572
+0.002
-0.36%
jan 1, 2006
-0.551
+0.021
-3.65%
jan 1, 2007
-0.497
+0.054
-9.78%
jan 1, 2008
-0.341
+0.156
-31.39%
jan 1, 2009
-0.214
+0.127
-37.18%
jan 1, 2010
-0.137
+0.078
-36.2%
jan 1, 2011
-0.126
+0.011
-7.83%
jan 1, 2012
-0.093
+0.033
-26.02%
jan 1, 2013
-0.037
+0.056
-59.78%
jan 1, 2014
-0.035
+0.002
-5.71%
jan 1, 2015
-0.062
-0.027
75.22%
jan 1, 2016
-0.13
-0.068
110.04%
Ranking of countries by current statistics by years


Comments: