29
/
en
AIzaSyAYiBZKx7MnpbEhh9jyipgxe19OcubqV5w
April 1, 2024
229155
Romania
ROU
true
2
1
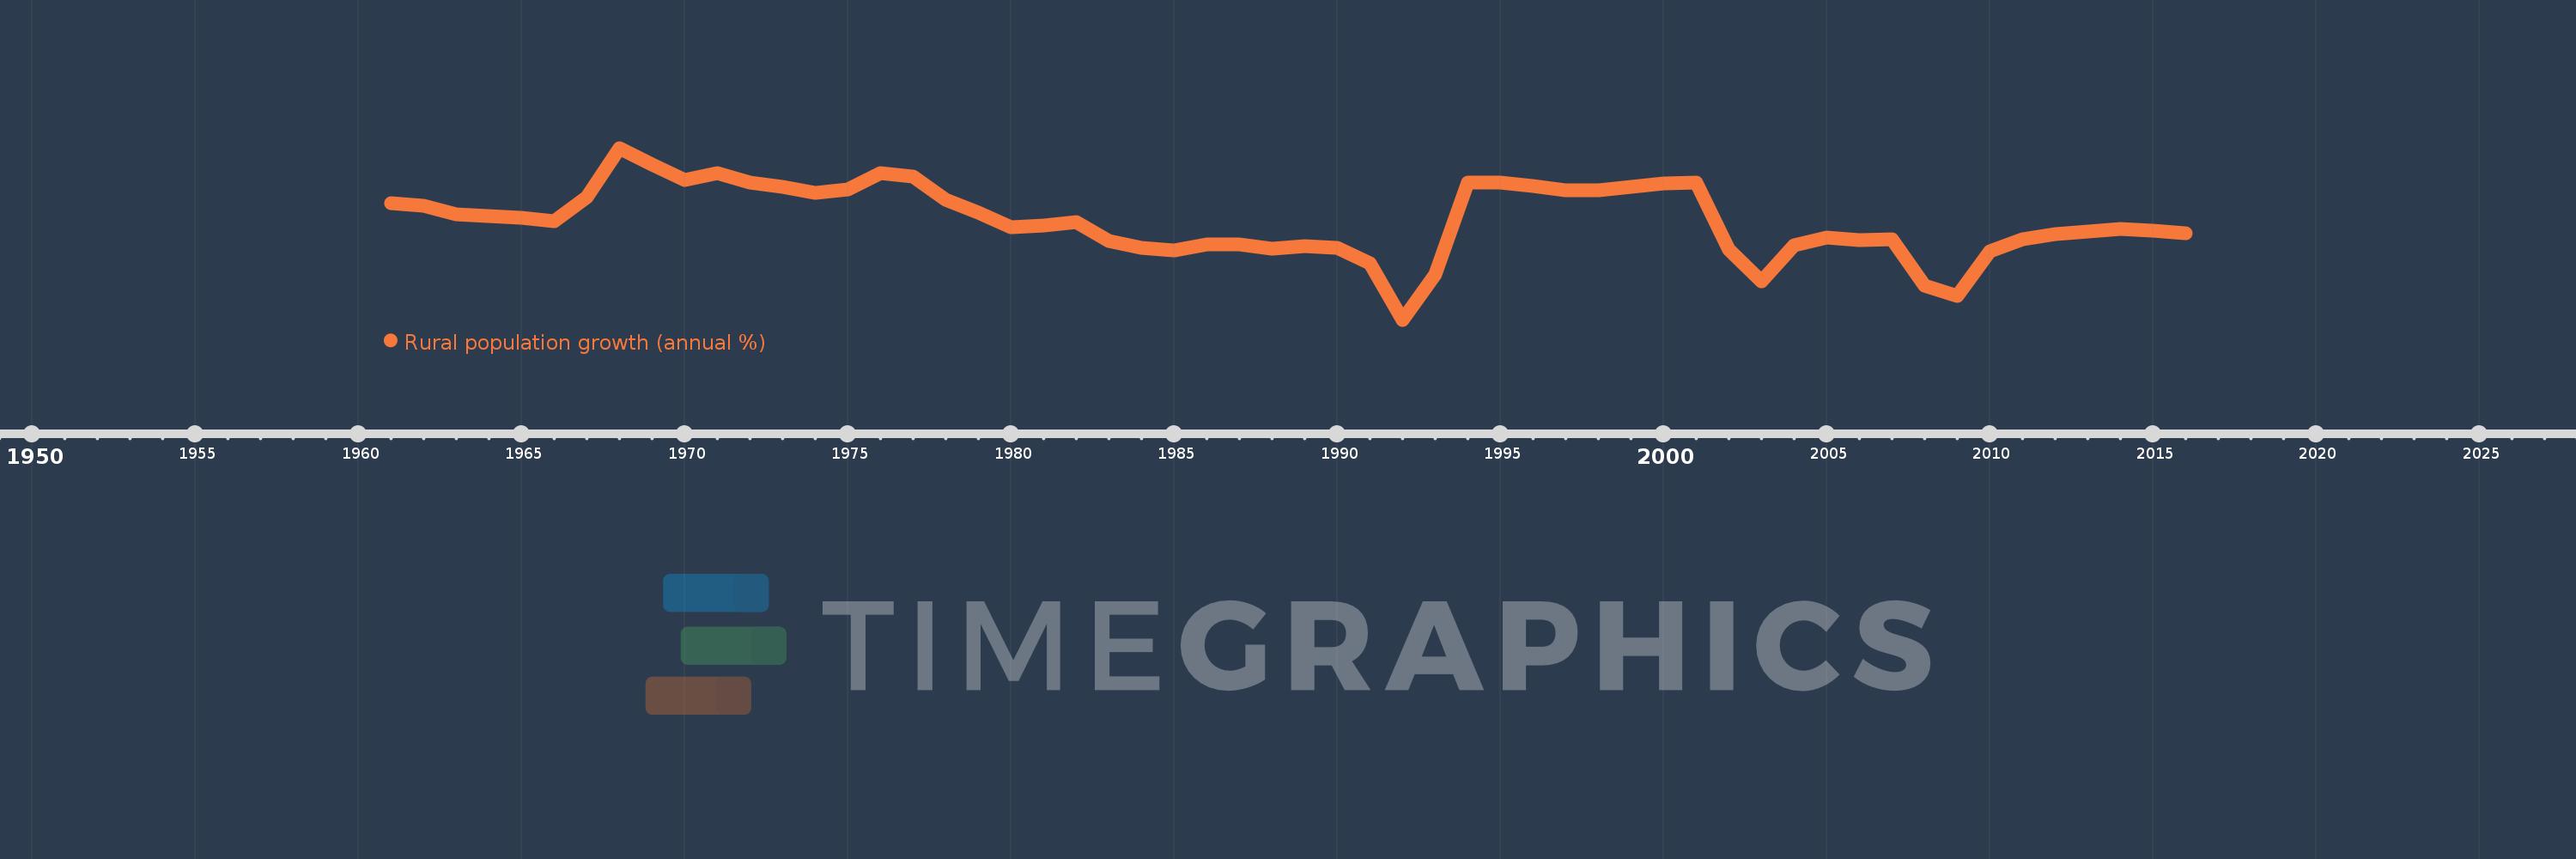
Rural population growth (annual %)
2016,2015,2014,2013,2012,2011,2010,2009,2008,2007,2006,2005,2004,2003,2002,2001,2000,1999,1998,1997,1996,1995,1994,1993,1992,1991,1990,1989,1988,1987,1986,1985,1984,1983,1982,1981,1980,1979,1978,1977,1976,1975,1974,1973,1972,1971,1970,1969,1968,1967,1966,1965,1964,1963,1962,1961
This statistics in other country:
AfghanistanAlbaniaAlgeriaAmerican SamoaAndorraAngolaAntigua and BarbudaArab WorldArgentinaArmeniaArubaAustraliaAustriaAzerbaijanBahamas, TheBahrainBangladeshBarbadosBelarusBelgiumBelizeBeninBhutanBoliviaBosnia and HerzegovinaBotswanaBrazilBritish Virgin IslandsBrunei DarussalamBulgariaBurkina FasoBurundiCabo VerdeCambodiaCameroonCanadaCaribbean small statesCentral African RepublicCentral Europe and the BalticsChadChannel IslandsChileChinaColombiaComorosCongo, Dem. Rep.Congo, Rep.Costa RicaCote d'IvoireCroatiaCubaCuracaoCyprusCzech RepublicDenmarkDjiboutiDominicaDominican RepublicEarly-demographic dividendEast Asia & PacificEast Asia & Pacific (excluding high income)East Asia & Pacific (IDA & IBRD countries)EcuadorEgypt, Arab Rep.El SalvadorEquatorial GuineaEritreaEstoniaEthiopiaEuro areaEurope & Central AsiaEurope & Central Asia (excluding high income)Europe & Central Asia (IDA & IBRD countries)European UnionFaroe IslandsFijiFinlandFragile and conflict affected situationsFranceFrench PolynesiaGabonGambia, TheGeorgiaGermanyGhanaGreeceGreenlandGrenadaGuamGuatemalaGuineaGuinea-BissauGuyanaHaitiHeavily indebted poor countries (HIPC)High incomeHondurasHong Kong SAR, ChinaHungaryIBRD onlyIcelandIDA & IBRD totalIDA blendIDA onlyIDA totalIndiaIndonesiaIran, Islamic Rep.IraqIrelandIsle of ManIsraelItalyJamaicaJapanJordanKazakhstanKenyaKiribatiKorea, Dem. People’s Rep.Korea, Rep.KuwaitKyrgyz RepublicLao PDRLate-demographic dividendLatin America & Caribbean Latin America & Caribbean (excluding high income)Latin America & the Caribbean (IDA & IBRD countries)LatviaLeast developed countries: UN classificationLebanonLesothoLiberiaLibyaLiechtensteinLithuaniaLow & middle incomeLow incomeLower middle incomeLuxembourgMacao SAR, ChinaMacedonia, FYRMadagascarMalawiMalaysiaMaldivesMaliMaltaMarshall IslandsMauritaniaMauritiusMexicoMicronesia, Fed. Sts.Middle East & North AfricaMiddle East & North Africa (excluding high income)Middle East & North Africa (IDA & IBRD countries)Middle incomeMoldovaMongoliaMontenegroMoroccoMozambiqueMyanmarNamibiaNauruNepalNetherlandsNew CaledoniaNew ZealandNicaraguaNigerNigeriaNorth AmericaNorthern Mariana IslandsNorwayOECD membersOmanOther small statesPacific island small statesPakistanPalauPanamaPapua New GuineaParaguayPeruPhilippinesPolandPortugalPost-demographic dividendPre-demographic dividendPuerto RicoQatarRomaniaRussian FederationRwandaSamoaSan MarinoSao Tome and PrincipeSaudi ArabiaSenegalSerbiaSeychellesSierra LeoneSlovak RepublicSloveniaSmall statesSolomon IslandsSomaliaSouth AfricaSouth AsiaSouth Asia (IDA & IBRD)South SudanSpainSri LankaSt. Kitts and NevisSt. LuciaSt. Vincent and the GrenadinesSub-Saharan Africa Sub-Saharan Africa (excluding high income)Sub-Saharan Africa (IDA & IBRD countries)SudanSurinameSwazilandSwedenSwitzerlandSyrian Arab RepublicTajikistanTanzaniaThailandTimor-LesteTogoTongaTrinidad and TobagoTunisiaTurkeyTurkmenistanTurks and Caicos IslandsTuvaluUgandaUkraineUnited Arab EmiratesUnited KingdomUnited StatesUpper middle incomeUruguayUzbekistanVanuatuVenezuela, RBVietnamVirgin Islands (U.S.)West Bank and GazaWorldYemen, Rep.ZambiaZimbabwe Timeline:
This timeline shows a graph from 1961 to 2016 of Romania. No data until 1960. Number of actual observations by date: 56.
Source name:
World Development Indicators
Source organization:
World Bank Staff estimates based on United Nations, World Urbanization Prospects.
Categories, topics:
Agriculture & Rural Development
Last updated:
apr 23, 2017
Indicators value changes by year
Minimum:
-2.404
jan 1, 1992
At the date of observation
Value
Absolute change
Change from previous value
jan 1, 1961
-0.197
-0.197
0.0%
jan 1, 1962
-0.244
-0.047
23.56%
jan 1, 1963
-0.417
-0.173
70.93%
jan 1, 1964
-0.442
-0.025
6.04%
jan 1, 1965
-0.47
-0.027
6.2%
jan 1, 1966
-0.537
-0.068
14.44%
jan 1, 1967
-0.084
+0.453
-84.37%
jan 1, 1968
0.848
+0.932
-1.11K%
jan 1, 1969
0.541
-0.306
-36.15%
jan 1, 1970
0.234
-0.307
-56.75%
jan 1, 1971
0.369
+0.135
57.75%
jan 1, 1972
0.198
-0.171
-46.44%
jan 1, 1973
0.105
-0.093
-46.87%
jan 1, 1974
-0.003
-0.108
-102.39%
jan 1, 1975
0.056
+0.058
-2.31K%
jan 1, 1976
0.367
+0.312
561.18%
jan 1, 1977
0.312
-0.055
-15.0%
jan 1, 1978
-0.126
-0.438
-140.28%
jan 1, 1979
-0.375
-0.25
198.53%
jan 1, 1980
-0.658
-0.283
75.33%
jan 1, 1981
-0.625
+0.033
-4.98%
jan 1, 1982
-0.555
+0.071
-11.29%
jan 1, 1983
-0.905
-0.35
63.13%
jan 1, 1984
-1.046
-0.141
15.59%
jan 1, 1985
-1.095
-0.05
4.75%
jan 1, 1986
-0.972
+0.124
-11.29%
jan 1, 1987
-0.977
-0.005
0.52%
jan 1, 1988
-1.059
-0.082
8.44%
jan 1, 1989
-1.006
+0.053
-5.04%
jan 1, 1990
-1.043
-0.037
3.69%
jan 1, 1991
-1.338
-0.295
28.33%
jan 1, 1992
-2.404
-1.066
79.66%
jan 1, 1993
-1.55
+0.854
-35.53%
jan 1, 1994
0.198
+1.748
-112.75%
jan 1, 1995
0.185
-0.013
-6.35%
jan 1, 1996
0.129
-0.056
-30.19%
jan 1, 1997
0.042
-0.087
-67.28%
jan 1, 1998
0.041
-0.001
-2.03%
jan 1, 1999
0.119
+0.078
187.6%
jan 1, 2000
0.17
+0.051
42.88%
jan 1, 2001
0.199
+0.029
16.81%
jan 1, 2002
-1.073
-1.271
-639.53%
jan 1, 2003
-1.678
-0.606
56.46%
jan 1, 2004
-1.001
+0.677
-40.34%
jan 1, 2005
-0.848
+0.153
-15.26%
jan 1, 2006
-0.897
-0.049
5.72%
jan 1, 2007
-0.873
+0.024
-2.71%
jan 1, 2008
-1.758
-0.886
101.49%
jan 1, 2009
-1.948
-0.19
10.8%
jan 1, 2010
-1.116
+0.833
-42.73%
jan 1, 2011
-0.877
+0.238
-21.36%
jan 1, 2012
-0.776
+0.101
-11.55%
jan 1, 2013
-0.73
+0.046
-5.91%
jan 1, 2014
-0.685
+0.045
-6.11%
jan 1, 2015
-0.72
-0.035
5.1%
jan 1, 2016
-0.761
-0.041
5.65%
Ranking of countries by current statistics by years


Comments: