29
/
en
AIzaSyAYiBZKx7MnpbEhh9jyipgxe19OcubqV5w
April 1, 2024
32165
Europe & Central Asia (excluding high income)
ECA
false
2
1
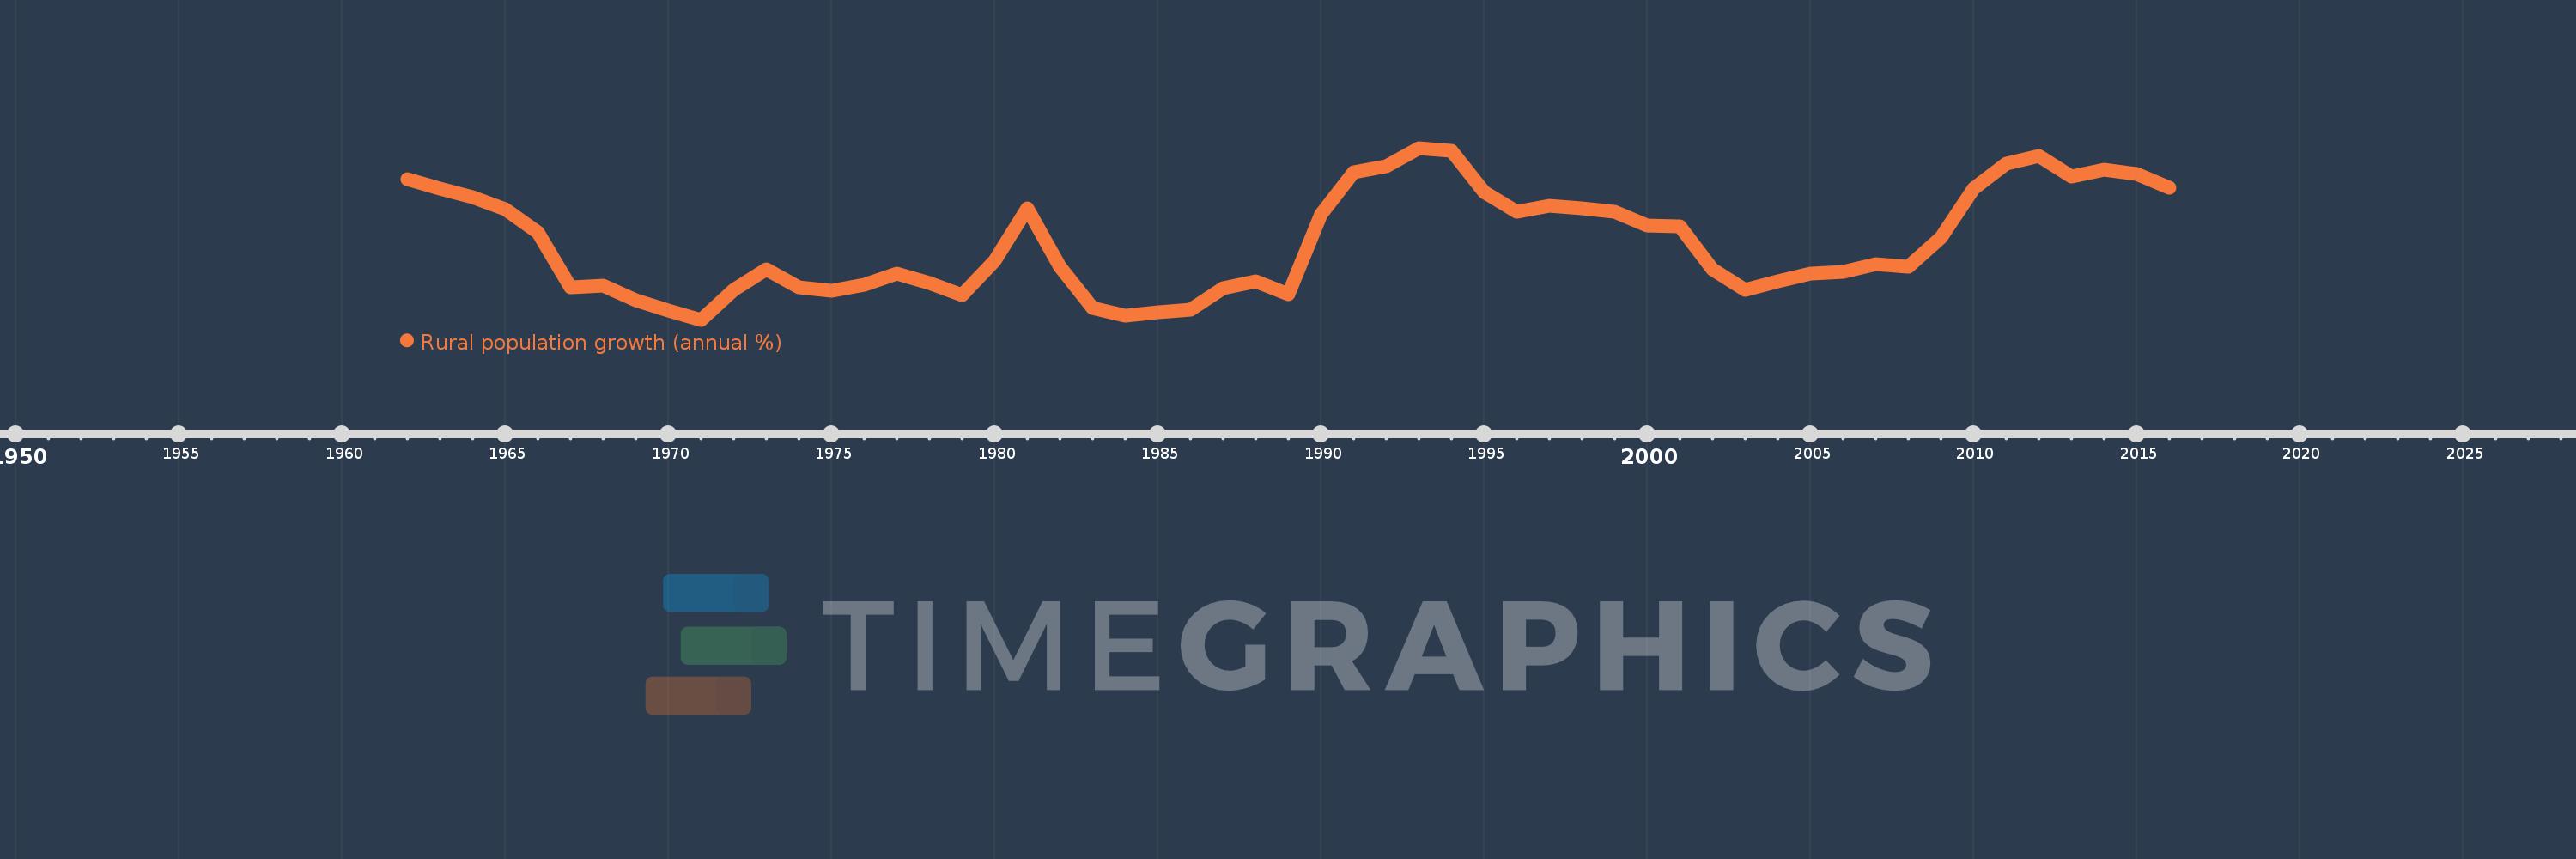
Rural population growth (annual %)
2016,2015,2014,2013,2012,2011,2010,2009,2008,2007,2006,2005,2004,2003,2002,2001,2000,1999,1998,1997,1996,1995,1994,1993,1992,1991,1990,1989,1988,1987,1986,1985,1984,1983,1982,1981,1980,1979,1978,1977,1976,1975,1974,1973,1972,1971,1970,1969,1968,1967,1966,1965,1964,1963,1962
This statistics in other country:
AfghanistanAlbaniaAlgeriaAmerican SamoaAndorraAngolaAntigua and BarbudaArab WorldArgentinaArmeniaArubaAustraliaAustriaAzerbaijanBahamas, TheBahrainBangladeshBarbadosBelarusBelgiumBelizeBeninBhutanBoliviaBosnia and HerzegovinaBotswanaBrazilBritish Virgin IslandsBrunei DarussalamBulgariaBurkina FasoBurundiCabo VerdeCambodiaCameroonCanadaCaribbean small statesCentral African RepublicCentral Europe and the BalticsChadChannel IslandsChileChinaColombiaComorosCongo, Dem. Rep.Congo, Rep.Costa RicaCote d'IvoireCroatiaCubaCuracaoCyprusCzech RepublicDenmarkDjiboutiDominicaDominican RepublicEarly-demographic dividendEast Asia & PacificEast Asia & Pacific (excluding high income)East Asia & Pacific (IDA & IBRD countries)EcuadorEgypt, Arab Rep.El SalvadorEquatorial GuineaEritreaEstoniaEthiopiaEuro areaEurope & Central AsiaEurope & Central Asia (excluding high income)Europe & Central Asia (IDA & IBRD countries)European UnionFaroe IslandsFijiFinlandFragile and conflict affected situationsFranceFrench PolynesiaGabonGambia, TheGeorgiaGermanyGhanaGreeceGreenlandGrenadaGuamGuatemalaGuineaGuinea-BissauGuyanaHaitiHeavily indebted poor countries (HIPC)High incomeHondurasHong Kong SAR, ChinaHungaryIBRD onlyIcelandIDA & IBRD totalIDA blendIDA onlyIDA totalIndiaIndonesiaIran, Islamic Rep.IraqIrelandIsle of ManIsraelItalyJamaicaJapanJordanKazakhstanKenyaKiribatiKorea, Dem. People’s Rep.Korea, Rep.KuwaitKyrgyz RepublicLao PDRLate-demographic dividendLatin America & Caribbean Latin America & Caribbean (excluding high income)Latin America & the Caribbean (IDA & IBRD countries)LatviaLeast developed countries: UN classificationLebanonLesothoLiberiaLibyaLiechtensteinLithuaniaLow & middle incomeLow incomeLower middle incomeLuxembourgMacao SAR, ChinaMacedonia, FYRMadagascarMalawiMalaysiaMaldivesMaliMaltaMarshall IslandsMauritaniaMauritiusMexicoMicronesia, Fed. Sts.Middle East & North AfricaMiddle East & North Africa (excluding high income)Middle East & North Africa (IDA & IBRD countries)Middle incomeMoldovaMongoliaMontenegroMoroccoMozambiqueMyanmarNamibiaNauruNepalNetherlandsNew CaledoniaNew ZealandNicaraguaNigerNigeriaNorth AmericaNorthern Mariana IslandsNorwayOECD membersOmanOther small statesPacific island small statesPakistanPalauPanamaPapua New GuineaParaguayPeruPhilippinesPolandPortugalPost-demographic dividendPre-demographic dividendPuerto RicoQatarRomaniaRussian FederationRwandaSamoaSan MarinoSao Tome and PrincipeSaudi ArabiaSenegalSerbiaSeychellesSierra LeoneSlovak RepublicSloveniaSmall statesSolomon IslandsSomaliaSouth AfricaSouth AsiaSouth Asia (IDA & IBRD)South SudanSpainSri LankaSt. Kitts and NevisSt. LuciaSt. Vincent and the GrenadinesSub-Saharan Africa Sub-Saharan Africa (excluding high income)Sub-Saharan Africa (IDA & IBRD countries)SudanSurinameSwazilandSwedenSwitzerlandSyrian Arab RepublicTajikistanTanzaniaThailandTimor-LesteTogoTongaTrinidad and TobagoTunisiaTurkeyTurkmenistanTurks and Caicos IslandsTuvaluUgandaUkraineUnited Arab EmiratesUnited KingdomUnited StatesUpper middle incomeUruguayUzbekistanVanuatuVenezuela, RBVietnamVirgin Islands (U.S.)West Bank and GazaWorldYemen, Rep.ZambiaZimbabwe Timeline:
This timeline shows a graph from 1962 to 2016 of Europe & Central Asia (excluding high income). No data until 1961. Number of actual observations by date: 55.
Source name:
World Development Indicators
Source organization:
World Bank Staff estimates based on United Nations, World Urbanization Prospects.
Categories, topics:
Agriculture & Rural Development
Last updated:
apr 23, 2017
Indicators value changes by year
Minimum:
-0.423
jan 1, 1971
At the date of observation
Value
Absolute change
Change from previous value
jan 1, 1962
0.163
+0.163
0.0%
jan 1, 1963
0.126
-0.037
-22.93%
jan 1, 1964
0.088
-0.037
-29.71%
jan 1, 1965
0.038
-0.051
-57.33%
jan 1, 1966
-0.059
-0.097
-257.05%
jan 1, 1967
-0.288
-0.229
385.91%
jan 1, 1968
-0.279
+0.009
-3.2%
jan 1, 1969
-0.342
-0.063
22.53%
jan 1, 1970
-0.383
-0.041
12.02%
jan 1, 1971
-0.423
-0.04
10.47%
jan 1, 1972
-0.299
+0.123
-29.2%
jan 1, 1973
-0.214
+0.085
-28.55%
jan 1, 1974
-0.287
-0.073
34.2%
jan 1, 1975
-0.302
-0.016
5.42%
jan 1, 1976
-0.278
+0.025
-8.23%
jan 1, 1977
-0.23
+0.047
-17.0%
jan 1, 1978
-0.268
-0.037
16.21%
jan 1, 1979
-0.319
-0.051
19.13%
jan 1, 1980
-0.176
+0.143
-44.71%
jan 1, 1981
0.044
+0.22
-124.75%
jan 1, 1982
-0.202
-0.246
-563.85%
jan 1, 1983
-0.374
-0.171
84.55%
jan 1, 1984
-0.407
-0.033
8.86%
jan 1, 1985
-0.393
+0.014
-3.44%
jan 1, 1986
-0.38
+0.013
-3.26%
jan 1, 1987
-0.292
+0.088
-23.24%
jan 1, 1988
-0.263
+0.029
-9.96%
jan 1, 1989
-0.318
-0.056
21.21%
jan 1, 1990
0.019
+0.338
-106.06%
jan 1, 1991
0.193
+0.173
898.59%
jan 1, 1992
0.22
+0.027
13.98%
jan 1, 1993
0.295
+0.075
34.05%
jan 1, 1994
0.283
-0.012
-4.08%
jan 1, 1995
0.111
-0.172
-60.8%
jan 1, 1996
0.03
-0.081
-73.28%
jan 1, 1997
0.053
+0.024
79.82%
jan 1, 1998
0.041
-0.012
-22.86%
jan 1, 1999
0.027
-0.014
-34.66%
jan 1, 2000
-0.03
-0.056
-210.52%
jan 1, 2001
-0.031
-0.001
3.1%
jan 1, 2002
-0.212
-0.181
593.33%
jan 1, 2003
-0.299
-0.087
40.98%
jan 1, 2004
-0.263
+0.036
-12.06%
jan 1, 2005
-0.232
+0.031
-11.7%
jan 1, 2006
-0.224
+0.008
-3.41%
jan 1, 2007
-0.19
+0.034
-15.12%
jan 1, 2008
-0.203
-0.013
6.73%
jan 1, 2009
-0.08
+0.123
-60.67%
jan 1, 2010
0.126
+0.206
-258.11%
jan 1, 2011
0.229
+0.103
81.77%
jan 1, 2012
0.263
+0.033
14.46%
jan 1, 2013
0.176
-0.087
-33.07%
jan 1, 2014
0.205
+0.029
16.63%
jan 1, 2015
0.187
-0.018
-8.89%
jan 1, 2016
0.127
-0.06
-32.07%
Ranking of countries by current statistics by years


Comments: