29
/
en
AIzaSyAYiBZKx7MnpbEhh9jyipgxe19OcubqV5w
April 1, 2024
267369
Trinidad and Tobago
TTO
true
2
1
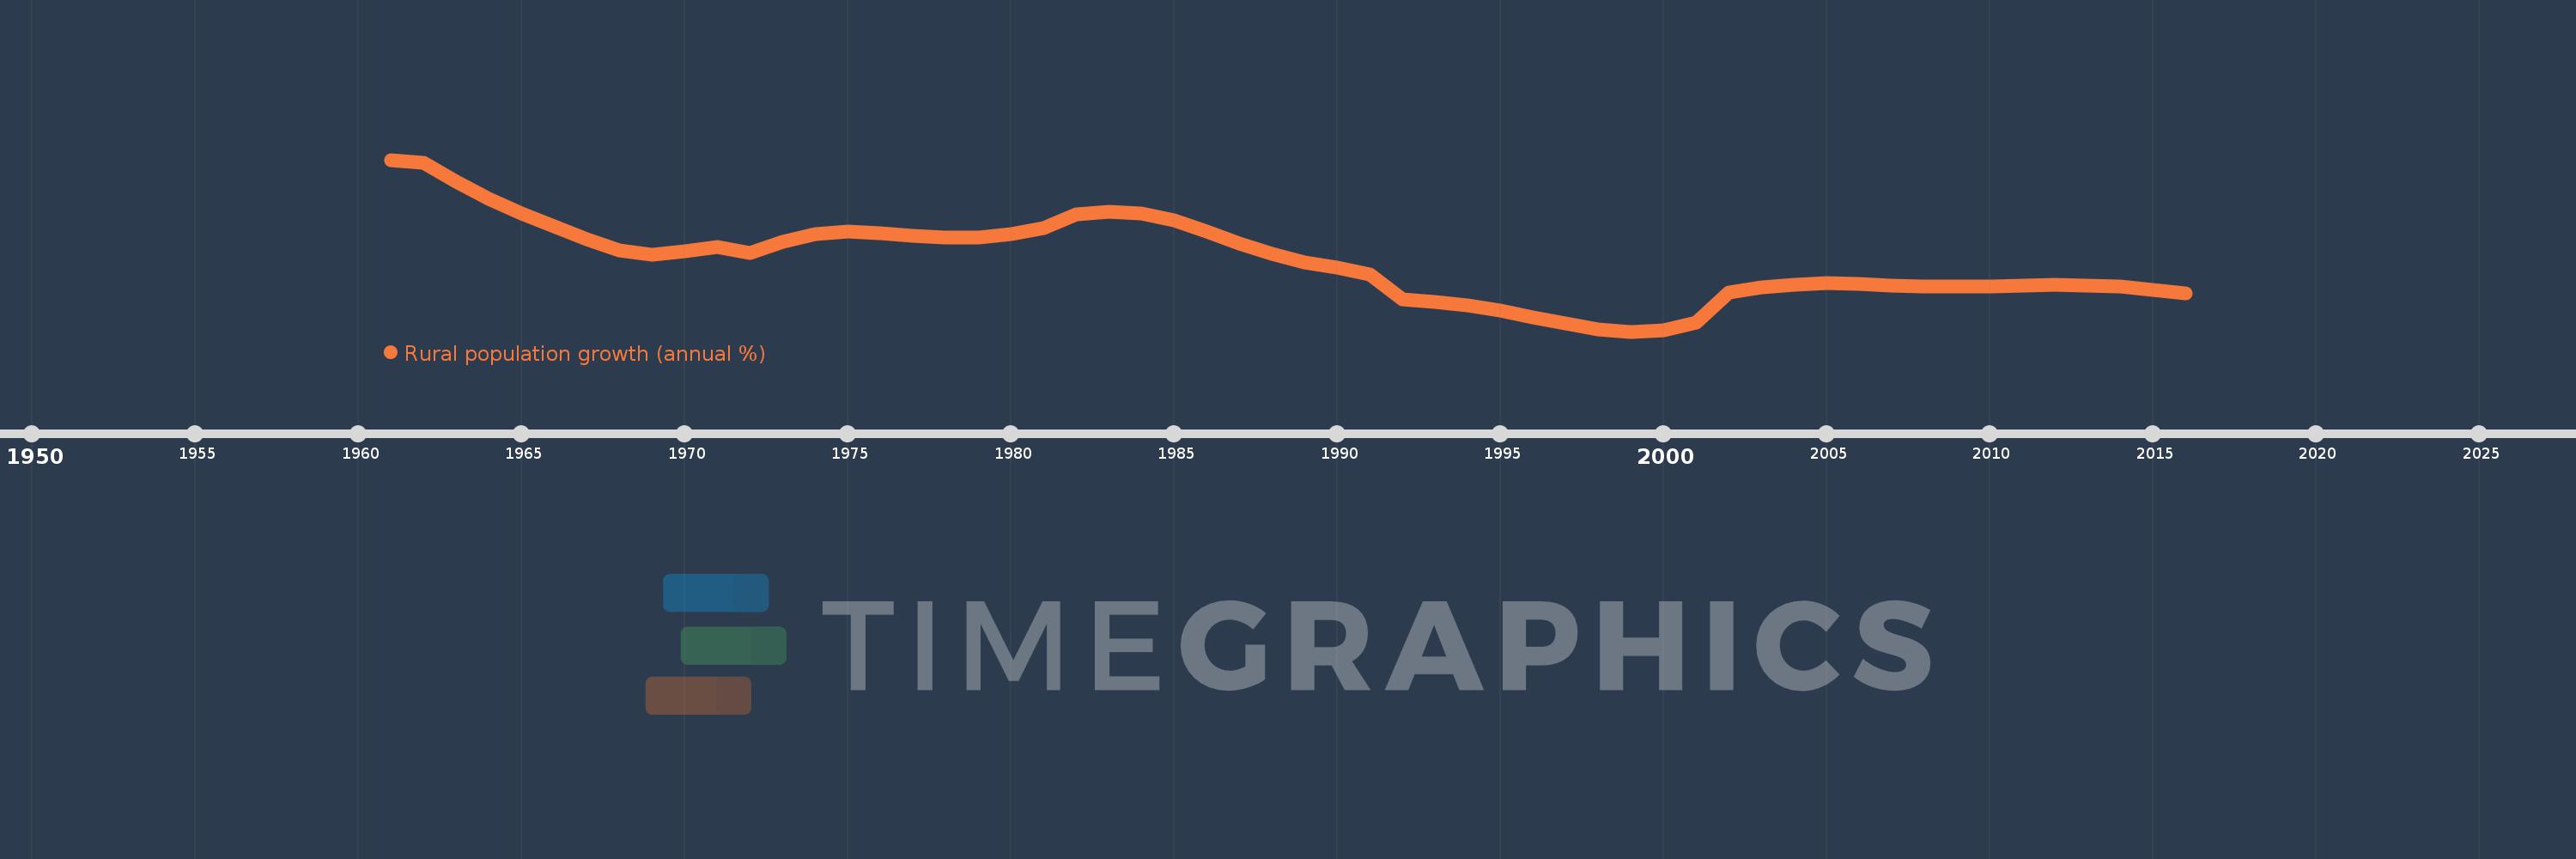
Rural population growth (annual %)
2016,2015,2014,2013,2012,2011,2010,2009,2008,2007,2006,2005,2004,2003,2002,2001,2000,1999,1998,1997,1996,1995,1994,1993,1992,1991,1990,1989,1988,1987,1986,1985,1984,1983,1982,1981,1980,1979,1978,1977,1976,1975,1974,1973,1972,1971,1970,1969,1968,1967,1966,1965,1964,1963,1962,1961
This statistics in other country:
AfghanistanAlbaniaAlgeriaAmerican SamoaAndorraAngolaAntigua and BarbudaArab WorldArgentinaArmeniaArubaAustraliaAustriaAzerbaijanBahamas, TheBahrainBangladeshBarbadosBelarusBelgiumBelizeBeninBhutanBoliviaBosnia and HerzegovinaBotswanaBrazilBritish Virgin IslandsBrunei DarussalamBulgariaBurkina FasoBurundiCabo VerdeCambodiaCameroonCanadaCaribbean small statesCentral African RepublicCentral Europe and the BalticsChadChannel IslandsChileChinaColombiaComorosCongo, Dem. Rep.Congo, Rep.Costa RicaCote d'IvoireCroatiaCubaCuracaoCyprusCzech RepublicDenmarkDjiboutiDominicaDominican RepublicEarly-demographic dividendEast Asia & PacificEast Asia & Pacific (excluding high income)East Asia & Pacific (IDA & IBRD countries)EcuadorEgypt, Arab Rep.El SalvadorEquatorial GuineaEritreaEstoniaEthiopiaEuro areaEurope & Central AsiaEurope & Central Asia (excluding high income)Europe & Central Asia (IDA & IBRD countries)European UnionFaroe IslandsFijiFinlandFragile and conflict affected situationsFranceFrench PolynesiaGabonGambia, TheGeorgiaGermanyGhanaGreeceGreenlandGrenadaGuamGuatemalaGuineaGuinea-BissauGuyanaHaitiHeavily indebted poor countries (HIPC)High incomeHondurasHong Kong SAR, ChinaHungaryIBRD onlyIcelandIDA & IBRD totalIDA blendIDA onlyIDA totalIndiaIndonesiaIran, Islamic Rep.IraqIrelandIsle of ManIsraelItalyJamaicaJapanJordanKazakhstanKenyaKiribatiKorea, Dem. People’s Rep.Korea, Rep.KuwaitKyrgyz RepublicLao PDRLate-demographic dividendLatin America & Caribbean Latin America & Caribbean (excluding high income)Latin America & the Caribbean (IDA & IBRD countries)LatviaLeast developed countries: UN classificationLebanonLesothoLiberiaLibyaLiechtensteinLithuaniaLow & middle incomeLow incomeLower middle incomeLuxembourgMacao SAR, ChinaMacedonia, FYRMadagascarMalawiMalaysiaMaldivesMaliMaltaMarshall IslandsMauritaniaMauritiusMexicoMicronesia, Fed. Sts.Middle East & North AfricaMiddle East & North Africa (excluding high income)Middle East & North Africa (IDA & IBRD countries)Middle incomeMoldovaMongoliaMontenegroMoroccoMozambiqueMyanmarNamibiaNauruNepalNetherlandsNew CaledoniaNew ZealandNicaraguaNigerNigeriaNorth AmericaNorthern Mariana IslandsNorwayOECD membersOmanOther small statesPacific island small statesPakistanPalauPanamaPapua New GuineaParaguayPeruPhilippinesPolandPortugalPost-demographic dividendPre-demographic dividendPuerto RicoQatarRomaniaRussian FederationRwandaSamoaSan MarinoSao Tome and PrincipeSaudi ArabiaSenegalSerbiaSeychellesSierra LeoneSlovak RepublicSloveniaSmall statesSolomon IslandsSomaliaSouth AfricaSouth AsiaSouth Asia (IDA & IBRD)South SudanSpainSri LankaSt. Kitts and NevisSt. LuciaSt. Vincent and the GrenadinesSub-Saharan Africa Sub-Saharan Africa (excluding high income)Sub-Saharan Africa (IDA & IBRD countries)SudanSurinameSwazilandSwedenSwitzerlandSyrian Arab RepublicTajikistanTanzaniaThailandTimor-LesteTogoTongaTrinidad and TobagoTunisiaTurkeyTurkmenistanTurks and Caicos IslandsTuvaluUgandaUkraineUnited Arab EmiratesUnited KingdomUnited StatesUpper middle incomeUruguayUzbekistanVanuatuVenezuela, RBVietnamVirgin Islands (U.S.)West Bank and GazaWorldYemen, Rep.ZambiaZimbabwe Timeline:
This timeline shows a graph from 1961 to 2016 of Trinidad and Tobago. No data until 1960. Number of actual observations by date: 56.
Source name:
World Development Indicators
Source organization:
World Bank Staff estimates based on United Nations, World Urbanization Prospects.
Categories, topics:
Agriculture & Rural Development
Last updated:
apr 23, 2017
Indicators value changes by year
Minimum:
-0.122
jan 1, 1999
At the date of observation
Value
Absolute change
Change from previous value
jan 1, 1961
2.795
+2.795
0.0%
jan 1, 1962
2.737
-0.058
-2.07%
jan 1, 1963
2.421
-0.316
-11.56%
jan 1, 1964
2.129
-0.292
-12.06%
jan 1, 1965
1.879
-0.249
-11.72%
jan 1, 1966
1.667
-0.212
-11.29%
jan 1, 1967
1.452
-0.215
-12.89%
jan 1, 1968
1.263
-0.19
-13.06%
jan 1, 1969
1.186
-0.077
-6.06%
jan 1, 1970
1.246
+0.06
5.06%
jan 1, 1971
1.311
+0.065
5.22%
jan 1, 1972
1.206
-0.105
-8.04%
jan 1, 1973
1.401
+0.196
16.24%
jan 1, 1974
1.534
+0.133
9.47%
jan 1, 1975
1.574
+0.04
2.58%
jan 1, 1976
1.549
-0.024
-1.56%
jan 1, 1977
1.502
-0.048
-3.08%
jan 1, 1978
1.476
-0.026
-1.7%
jan 1, 1979
1.48
+0.004
0.27%
jan 1, 1980
1.529
+0.049
3.34%
jan 1, 1981
1.63
+0.101
6.59%
jan 1, 1982
1.873
+0.243
14.9%
jan 1, 1983
1.912
+0.039
2.08%
jan 1, 1984
1.882
-0.03
-1.57%
jan 1, 1985
1.76
-0.122
-6.49%
jan 1, 1986
1.578
-0.182
-10.36%
jan 1, 1987
1.375
-0.203
-12.85%
jan 1, 1988
1.196
-0.179
-12.99%
jan 1, 1989
1.053
-0.143
-11.94%
jan 1, 1990
0.965
-0.089
-8.43%
jan 1, 1991
0.841
-0.124
-12.84%
jan 1, 1992
0.425
-0.416
-49.44%
jan 1, 1993
0.381
-0.044
-10.44%
jan 1, 1994
0.318
-0.062
-16.41%
jan 1, 1995
0.229
-0.089
-28.1%
jan 1, 1996
0.123
-0.106
-46.17%
jan 1, 1997
0.011
-0.112
-91.34%
jan 1, 1998
-0.08
-0.09
-847.37%
jan 1, 1999
-0.122
-0.042
52.48%
jan 1, 2000
-0.099
+0.023
-18.72%
jan 1, 2001
0.032
+0.131
-132.48%
jan 1, 2002
0.548
+0.516
1.61K%
jan 1, 2003
0.627
+0.079
14.34%
jan 1, 2004
0.68
+0.053
8.5%
jan 1, 2005
0.695
+0.015
2.19%
jan 1, 2006
0.683
-0.012
-1.66%
jan 1, 2007
0.663
-0.021
-3.04%
jan 1, 2008
0.65
-0.013
-1.91%
jan 1, 2009
0.646
-0.004
-0.65%
jan 1, 2010
0.65
+0.004
0.57%
jan 1, 2011
0.661
+0.012
1.82%
jan 1, 2012
0.673
+0.012
1.79%
jan 1, 2013
0.663
-0.01
-1.49%
jan 1, 2014
0.637
-0.026
-3.99%
jan 1, 2015
0.589
-0.048
-7.5%
jan 1, 2016
0.528
-0.061
-10.39%
Ranking of countries by current statistics by years


Comments: