29
/
en
AIzaSyAYiBZKx7MnpbEhh9jyipgxe19OcubqV5w
April 1, 2024
69796
Argentina
ARG
true
2
1
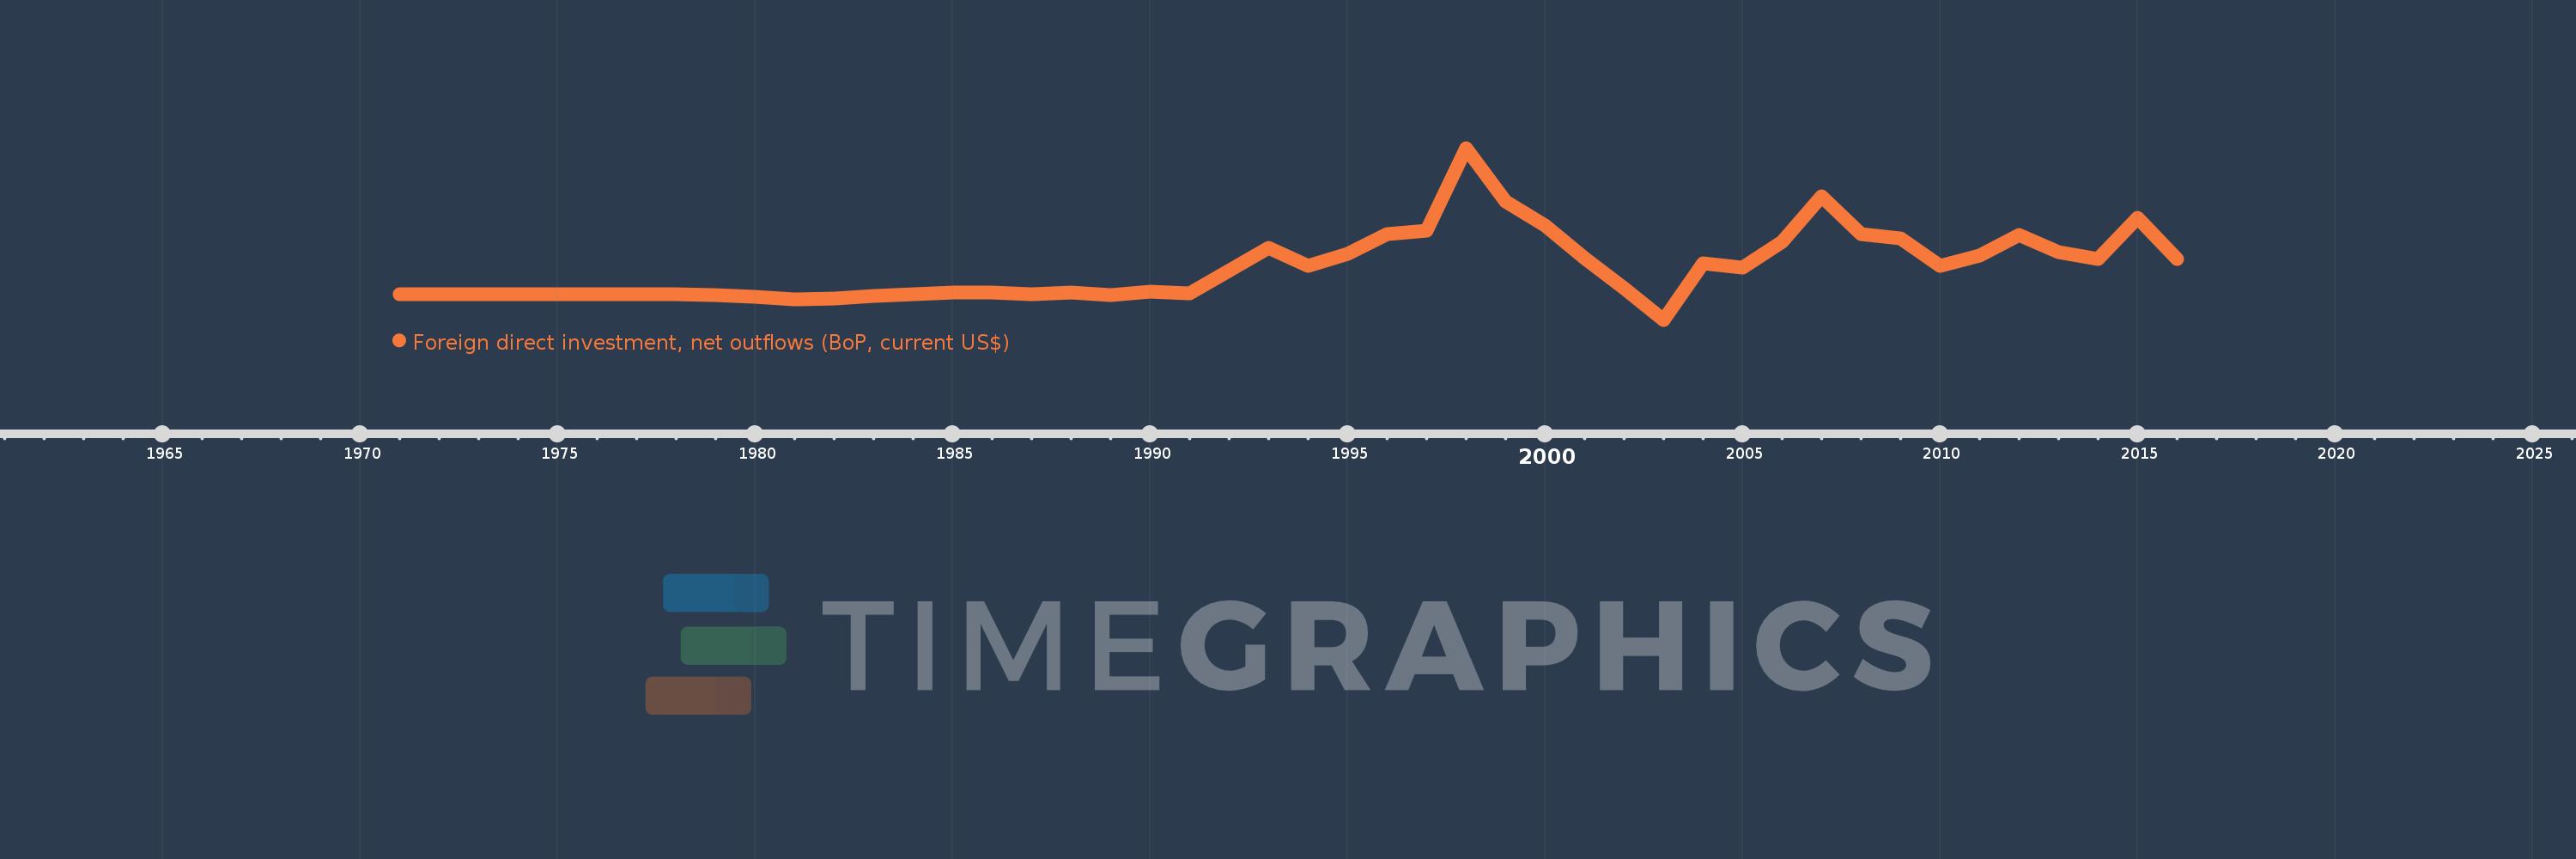
Foreign direct investment, net outflows (BoP, current US$)
2016,2015,2014,2013,2012,2011,2010,2009,2008,2007,2006,2005,2004,2003,2002,2001,2000,1999,1998,1997,1996,1995,1994,1993,1991,1990,1989,1988,1987,1986,1985,1984,1983,1982,1981,1980,1979,1978,1977,1976,1975,1974,1973,1972,1971
This statistics in other country:
AfghanistanAlbaniaAlgeriaAngolaAntigua and BarbudaArab WorldArgentinaArmeniaArubaAustraliaAustriaAzerbaijanBahamas, TheBahrainBangladeshBarbadosBelarusBelgiumBelizeBeninBermudaBoliviaBosnia and HerzegovinaBotswanaBrazilBritish Virgin IslandsBrunei DarussalamBulgariaBurkina FasoBurundiCabo VerdeCambodiaCameroonCanadaCaribbean small statesCayman IslandsCentral African RepublicCentral Europe and the BalticsChadChileChinaColombiaComorosCongo, Dem. Rep.Congo, Rep.Costa RicaCote d'IvoireCroatiaCuracaoCyprusCzech RepublicDenmarkDominicaDominican RepublicEarly-demographic dividendEast Asia & PacificEast Asia & Pacific (excluding high income)East Asia & Pacific (IDA & IBRD countries)EcuadorEgypt, Arab Rep.El SalvadorEquatorial GuineaEritreaEstoniaEuro areaEurope & Central AsiaEurope & Central Asia (excluding high income)Europe & Central Asia (IDA & IBRD countries)European UnionFijiFinlandFragile and conflict affected situationsFranceFrench PolynesiaGabonGambia, TheGeorgiaGermanyGhanaGreeceGrenadaGuatemalaGuineaGuinea-BissauGuyanaHaitiHeavily indebted poor countries (HIPC)High incomeHondurasHong Kong SAR, ChinaHungaryIBRD onlyIcelandIDA & IBRD totalIDA blendIDA onlyIDA totalIndiaIndonesiaIran, Islamic Rep.IraqIrelandIsraelItalyJamaicaJapanJordanKazakhstanKenyaKiribatiKorea, Dem. People’s Rep.Korea, Rep.KosovoKuwaitKyrgyz RepublicLao PDRLate-demographic dividendLatin America & Caribbean Latin America & Caribbean (excluding high income)Latin America & the Caribbean (IDA & IBRD countries)LatviaLeast developed countries: UN classificationLebanonLesothoLiberiaLibyaLithuaniaLow & middle incomeLow incomeLower middle incomeLuxembourgMacao SAR, ChinaMacedonia, FYRMadagascarMalawiMalaysiaMaliMaltaMarshall IslandsMauritaniaMauritiusMexicoMicronesia, Fed. Sts.Middle East & North AfricaMiddle East & North Africa (excluding high income)Middle East & North Africa (IDA & IBRD countries)Middle incomeMoldovaMongoliaMontenegroMoroccoMozambiqueNamibiaNauruNetherlandsNew CaledoniaNew ZealandNicaraguaNigerNigeriaNorth AmericaNorthern Mariana IslandsNorwayOECD membersOmanOther small statesPacific island small statesPakistanPalauPanamaPapua New GuineaParaguayPeruPhilippinesPolandPortugalPost-demographic dividendPre-demographic dividendQatarRomaniaRussian FederationRwandaSamoaSao Tome and PrincipeSaudi ArabiaSenegalSerbiaSeychellesSierra LeoneSingaporeSint Maarten (Dutch part)Slovak RepublicSloveniaSmall statesSolomon IslandsSouth AfricaSouth AsiaSouth Asia (IDA & IBRD)SpainSri LankaSt. Kitts and NevisSt. LuciaSt. Vincent and the GrenadinesSub-Saharan Africa Sub-Saharan Africa (excluding high income)Sub-Saharan Africa (IDA & IBRD countries)SurinameSwazilandSwedenSwitzerlandSyrian Arab RepublicTajikistanTanzaniaThailandTimor-LesteTogoTongaTrinidad and TobagoTunisiaTurkeyUgandaUkraineUnited Arab EmiratesUnited KingdomUnited StatesUpper middle incomeUruguayVanuatuVenezuela, RBVietnamWest Bank and GazaWorldYemen, Rep.ZambiaZimbabwe Timeline:
This timeline shows a graph from 1971 to 2016 of Argentina. No data until 1970. Number of actual observations by date: 45.
Source name:
World Development Indicators
Source organization:
International Monetary Fund, Balance of Payments database, supplemented by data from the United Nations Conference on Trade and Development and official national sources.
Categories, topics:
Economy & Growth, Financial Sector
Last updated:
apr 23, 2017
Indicators value changes by year
Minimum:
-627.14 mln
jan 1, 2003
Maximum:
3.653 bln
jan 1, 1998
At the date of observation
Value
Absolute change
Change from previous value
jan 1, 1971
1.817 mln
+1.817 mln
0.0%
jan 1, 1972
0.0
-1.817 mln
-100.0%
jan 1, 1973
1.673 mln
+1.673 mln
%
jan 1, 1974
0.0
-1.673 mln
-100.0%
jan 1, 1975
2.396 mln
+2.396 mln
%
jan 1, 1976
4.487 mln
+2.091 mln
87.27%
jan 1, 1977
1.542 mln
-2.945 mln
-65.63%
jan 1, 1978
-1000.0K
-2.542 mln
-164.85%
jan 1, 1979
-23.0 mln
-22.0 mln
2.2K%
jan 1, 1980
-59.0 mln
-36.0 mln
156.52%
jan 1, 1981
-110.0 mln
-51.0 mln
86.44%
jan 1, 1982
-107.0 mln
+3.0 mln
-2.73%
jan 1, 1983
-30.0 mln
+77.0 mln
-71.96%
jan 1, 1984
2.0 mln
+32.0 mln
-106.67%
jan 1, 1985
43.559 mln
+41.559 mln
2.08K%
jan 1, 1986
42.349 mln
-1.21 mln
-2.78%
jan 1, 1987
11.2 mln
-31.149 mln
-73.55%
jan 1, 1988
48.131 mln
+36.931 mln
329.75%
jan 1, 1989
-22.677 mln
-70.808 mln
-147.12%
jan 1, 1990
64.401 mln
+87.078 mln
-383.99%
jan 1, 1991
34.903 mln
-29.498 mln
-45.8%
jan 1, 1993
1.166 bln
+1.131 bln
3.24K%
jan 1, 1994
705.07 mln
-460.844 mln
-39.53%
jan 1, 1995
1.013 bln
+307.774 mln
43.65%
jan 1, 1996
1.497 bln
+484.305 mln
47.82%
jan 1, 1997
1.601 bln
+103.6 mln
6.92%
jan 1, 1998
3.653 bln
+2.052 bln
128.19%
jan 1, 1999
2.325 bln
-1.327 bln
-36.34%
jan 1, 2000
1.73 bln
-595.194 mln
-25.59%
jan 1, 2001
901.028 mln
-829.255 mln
-47.93%
jan 1, 2002
160.877 mln
-740.152 mln
-82.15%
jan 1, 2003
-627.14 mln
-788.017 mln
-489.83%
jan 1, 2004
773.78 mln
+1.401 bln
-223.38%
jan 1, 2005
675.99 mln
-97.79 mln
-12.64%
jan 1, 2006
1.311 bln
+635.07 mln
93.95%
jan 1, 2007
2.439 bln
+1.128 bln
86.01%
jan 1, 2008
1.504 bln
-934.48 mln
-38.32%
jan 1, 2009
1.391 bln
-113.3 mln
-7.53%
jan 1, 2010
711.546 mln
-679.384 mln
-48.84%
jan 1, 2011
964.761 mln
+253.214 mln
35.59%
jan 1, 2012
1.488 bln
+523.239 mln
54.24%
jan 1, 2013
1.055 bln
-433.15 mln
-29.11%
jan 1, 2014
889.973 mln
-164.877 mln
-15.63%
jan 1, 2015
1.921 bln
+1.031 bln
115.8%
jan 1, 2016
875.233 mln
-1.045 bln
-54.43%
Ranking of countries by current statistics by years


Comments: