29
/
en
AIzaSyAYiBZKx7MnpbEhh9jyipgxe19OcubqV5w
April 1, 2024
81731
Belgium
BEL
true
2
1
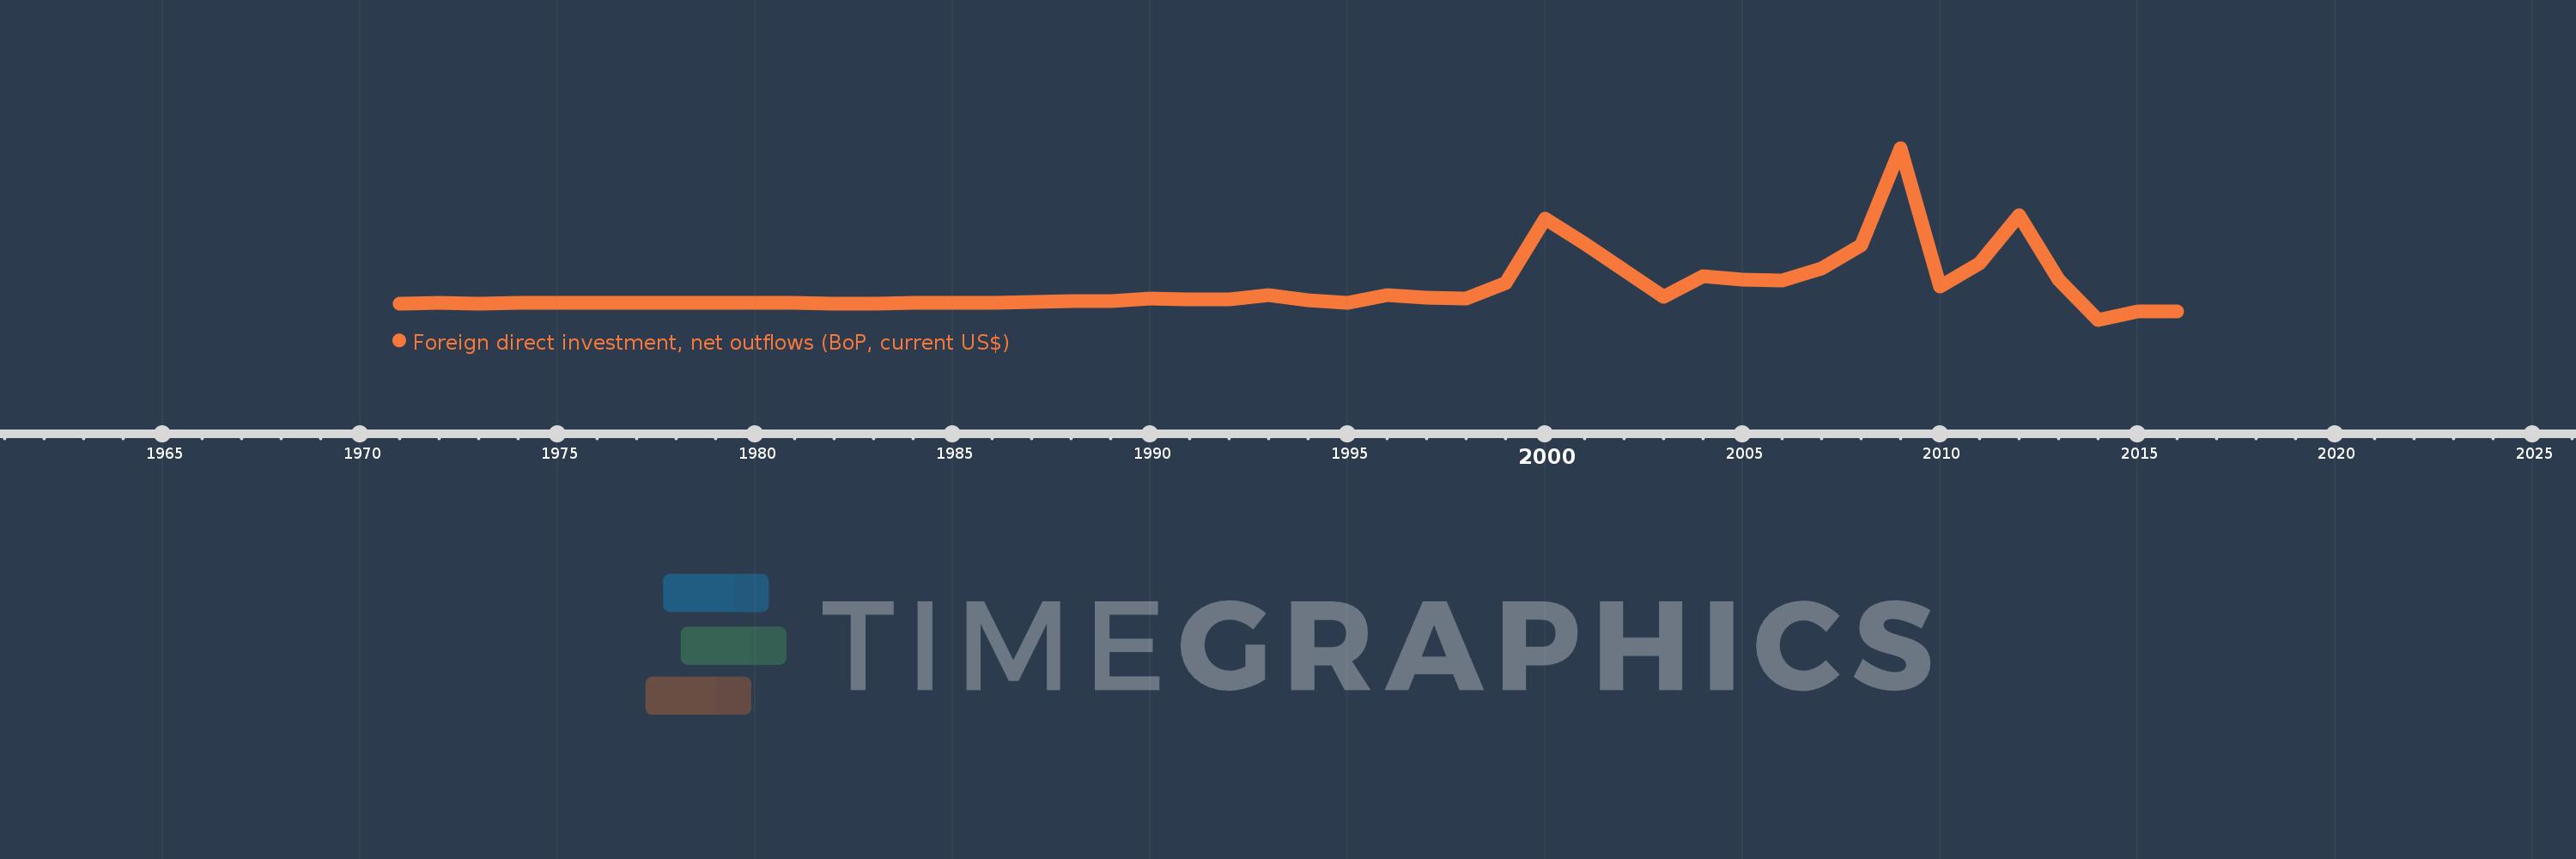
Foreign direct investment, net outflows (BoP, current US$)
2016,2015,2014,2013,2012,2011,2010,2009,2008,2007,2006,2005,2004,2003,2001,2000,1999,1998,1997,1996,1995,1994,1993,1992,1991,1990,1989,1988,1987,1986,1985,1984,1983,1982,1981,1980,1979,1978,1977,1976,1975,1974,1973,1972,1971
This statistics in other country:
AfghanistanAlbaniaAlgeriaAngolaAntigua and BarbudaArab WorldArgentinaArmeniaArubaAustraliaAustriaAzerbaijanBahamas, TheBahrainBangladeshBarbadosBelarusBelgiumBelizeBeninBermudaBoliviaBosnia and HerzegovinaBotswanaBrazilBritish Virgin IslandsBrunei DarussalamBulgariaBurkina FasoBurundiCabo VerdeCambodiaCameroonCanadaCaribbean small statesCayman IslandsCentral African RepublicCentral Europe and the BalticsChadChileChinaColombiaComorosCongo, Dem. Rep.Congo, Rep.Costa RicaCote d'IvoireCroatiaCuracaoCyprusCzech RepublicDenmarkDominicaDominican RepublicEarly-demographic dividendEast Asia & PacificEast Asia & Pacific (excluding high income)East Asia & Pacific (IDA & IBRD countries)EcuadorEgypt, Arab Rep.El SalvadorEquatorial GuineaEritreaEstoniaEuro areaEurope & Central AsiaEurope & Central Asia (excluding high income)Europe & Central Asia (IDA & IBRD countries)European UnionFijiFinlandFragile and conflict affected situationsFranceFrench PolynesiaGabonGambia, TheGeorgiaGermanyGhanaGreeceGrenadaGuatemalaGuineaGuinea-BissauGuyanaHaitiHeavily indebted poor countries (HIPC)High incomeHondurasHong Kong SAR, ChinaHungaryIBRD onlyIcelandIDA & IBRD totalIDA blendIDA onlyIDA totalIndiaIndonesiaIran, Islamic Rep.IraqIrelandIsraelItalyJamaicaJapanJordanKazakhstanKenyaKiribatiKorea, Dem. People’s Rep.Korea, Rep.KosovoKuwaitKyrgyz RepublicLao PDRLate-demographic dividendLatin America & Caribbean Latin America & Caribbean (excluding high income)Latin America & the Caribbean (IDA & IBRD countries)LatviaLeast developed countries: UN classificationLebanonLesothoLiberiaLibyaLithuaniaLow & middle incomeLow incomeLower middle incomeLuxembourgMacao SAR, ChinaMacedonia, FYRMadagascarMalawiMalaysiaMaliMaltaMarshall IslandsMauritaniaMauritiusMexicoMicronesia, Fed. Sts.Middle East & North AfricaMiddle East & North Africa (excluding high income)Middle East & North Africa (IDA & IBRD countries)Middle incomeMoldovaMongoliaMontenegroMoroccoMozambiqueNamibiaNauruNetherlandsNew CaledoniaNew ZealandNicaraguaNigerNigeriaNorth AmericaNorthern Mariana IslandsNorwayOECD membersOmanOther small statesPacific island small statesPakistanPalauPanamaPapua New GuineaParaguayPeruPhilippinesPolandPortugalPost-demographic dividendPre-demographic dividendQatarRomaniaRussian FederationRwandaSamoaSao Tome and PrincipeSaudi ArabiaSenegalSerbiaSeychellesSierra LeoneSingaporeSint Maarten (Dutch part)Slovak RepublicSloveniaSmall statesSolomon IslandsSouth AfricaSouth AsiaSouth Asia (IDA & IBRD)SpainSri LankaSt. Kitts and NevisSt. LuciaSt. Vincent and the GrenadinesSub-Saharan Africa Sub-Saharan Africa (excluding high income)Sub-Saharan Africa (IDA & IBRD countries)SurinameSwazilandSwedenSwitzerlandSyrian Arab RepublicTajikistanTanzaniaThailandTimor-LesteTogoTongaTrinidad and TobagoTunisiaTurkeyUgandaUkraineUnited Arab EmiratesUnited KingdomUnited StatesUpper middle incomeUruguayVanuatuVenezuela, RBVietnamWest Bank and GazaWorldYemen, Rep.ZambiaZimbabwe Timeline:
This timeline shows a graph from 1971 to 2016 of Belgium. No data until 1970. Number of actual observations by date: 45.
Source name:
World Development Indicators
Source organization:
International Monetary Fund, Balance of Payments database, supplemented by data from the United Nations Conference on Trade and Development and official national sources.
Categories, topics:
Economy & Growth, Financial Sector
Last updated:
apr 23, 2017
Indicators value changes by year
Minimum:
-23.52 bln
jan 1, 2014
Maximum:
223.39 bln
jan 1, 2009
At the date of observation
Value
Absolute change
Change from previous value
jan 1, 1971
174.0 mln
+174.0 mln
0.0%
jan 1, 1972
206.0 mln
+32.0 mln
18.39%
jan 1, 1973
177.0 mln
-29.0 mln
-14.08%
jan 1, 1974
269.0 mln
+92.0 mln
51.98%
jan 1, 1975
479.0 mln
+210.0 mln
78.07%
jan 1, 1976
237.82 mln
-241.18 mln
-50.35%
jan 1, 1977
351.81 mln
+113.99 mln
47.93%
jan 1, 1978
465.21 mln
+113.4 mln
32.23%
jan 1, 1979
559.77 mln
+94.56 mln
20.33%
jan 1, 1980
1.341 bln
+780.91 mln
139.51%
jan 1, 1981
196.03 mln
-1.145 bln
-85.38%
jan 1, 1982
103.79 mln
-92.24 mln
-47.05%
jan 1, 1983
-69.06 mln
-172.85 mln
-166.54%
jan 1, 1984
354.72 mln
+423.78 mln
-613.64%
jan 1, 1985
292.87 mln
-61.85 mln
-17.44%
jan 1, 1986
296.49 mln
+3.62 mln
1.24%
jan 1, 1987
1.723 bln
+1.427 bln
481.13%
jan 1, 1988
2.782 bln
+1.059 bln
61.48%
jan 1, 1989
3.784 bln
+1.002 bln
36.01%
jan 1, 1990
6.486 bln
+2.702 bln
71.41%
jan 1, 1991
6.314 bln
-171.8 mln
-2.65%
jan 1, 1992
6.271 bln
-43.51 mln
-0.69%
jan 1, 1993
11.407 bln
+5.136 bln
81.9%
jan 1, 1994
4.904 bln
-6.503 bln
-57.01%
jan 1, 1995
1.371 bln
-3.532 bln
-72.03%
jan 1, 1996
11.603 bln
+10.232 bln
746.08%
jan 1, 1997
8.026 bln
-3.577 bln
-30.83%
jan 1, 1998
7.252 bln
-774.0 mln
-9.64%
jan 1, 1999
28.845 bln
+21.593 bln
297.75%
jan 1, 2000
122.304 bln
+93.459 bln
324.0%
jan 1, 2001
86.362 bln
-35.942 bln
-29.39%
jan 1, 2003
8.902 bln
-77.46 bln
-89.69%
jan 1, 2004
39.043 bln
+30.141 bln
338.58%
jan 1, 2005
34.682 bln
-4.361 bln
-11.17%
jan 1, 2006
32.545 bln
-2.137 bln
-6.16%
jan 1, 2007
50.14 bln
+17.595 bln
54.06%
jan 1, 2008
83.492 bln
+33.353 bln
66.52%
jan 1, 2009
223.39 bln
+139.898 bln
167.56%
jan 1, 2010
24.742 bln
-198.649 bln
-88.92%
jan 1, 2011
58.046 bln
+33.305 bln
134.61%
jan 1, 2012
126.12 bln
+68.073 bln
117.27%
jan 1, 2013
33.855 bln
-92.265 bln
-73.16%
jan 1, 2014
-23.52 bln
-57.375 bln
-169.47%
jan 1, 2015
-11.895 bln
+11.625 bln
-49.43%
jan 1, 2016
-11.823 bln
+72.062 mln
-0.61%
Ranking of countries by current statistics by years


Comments: