29
/
en
AIzaSyAYiBZKx7MnpbEhh9jyipgxe19OcubqV5w
April 1, 2024
65986
Algeria
DZA
true
2
1
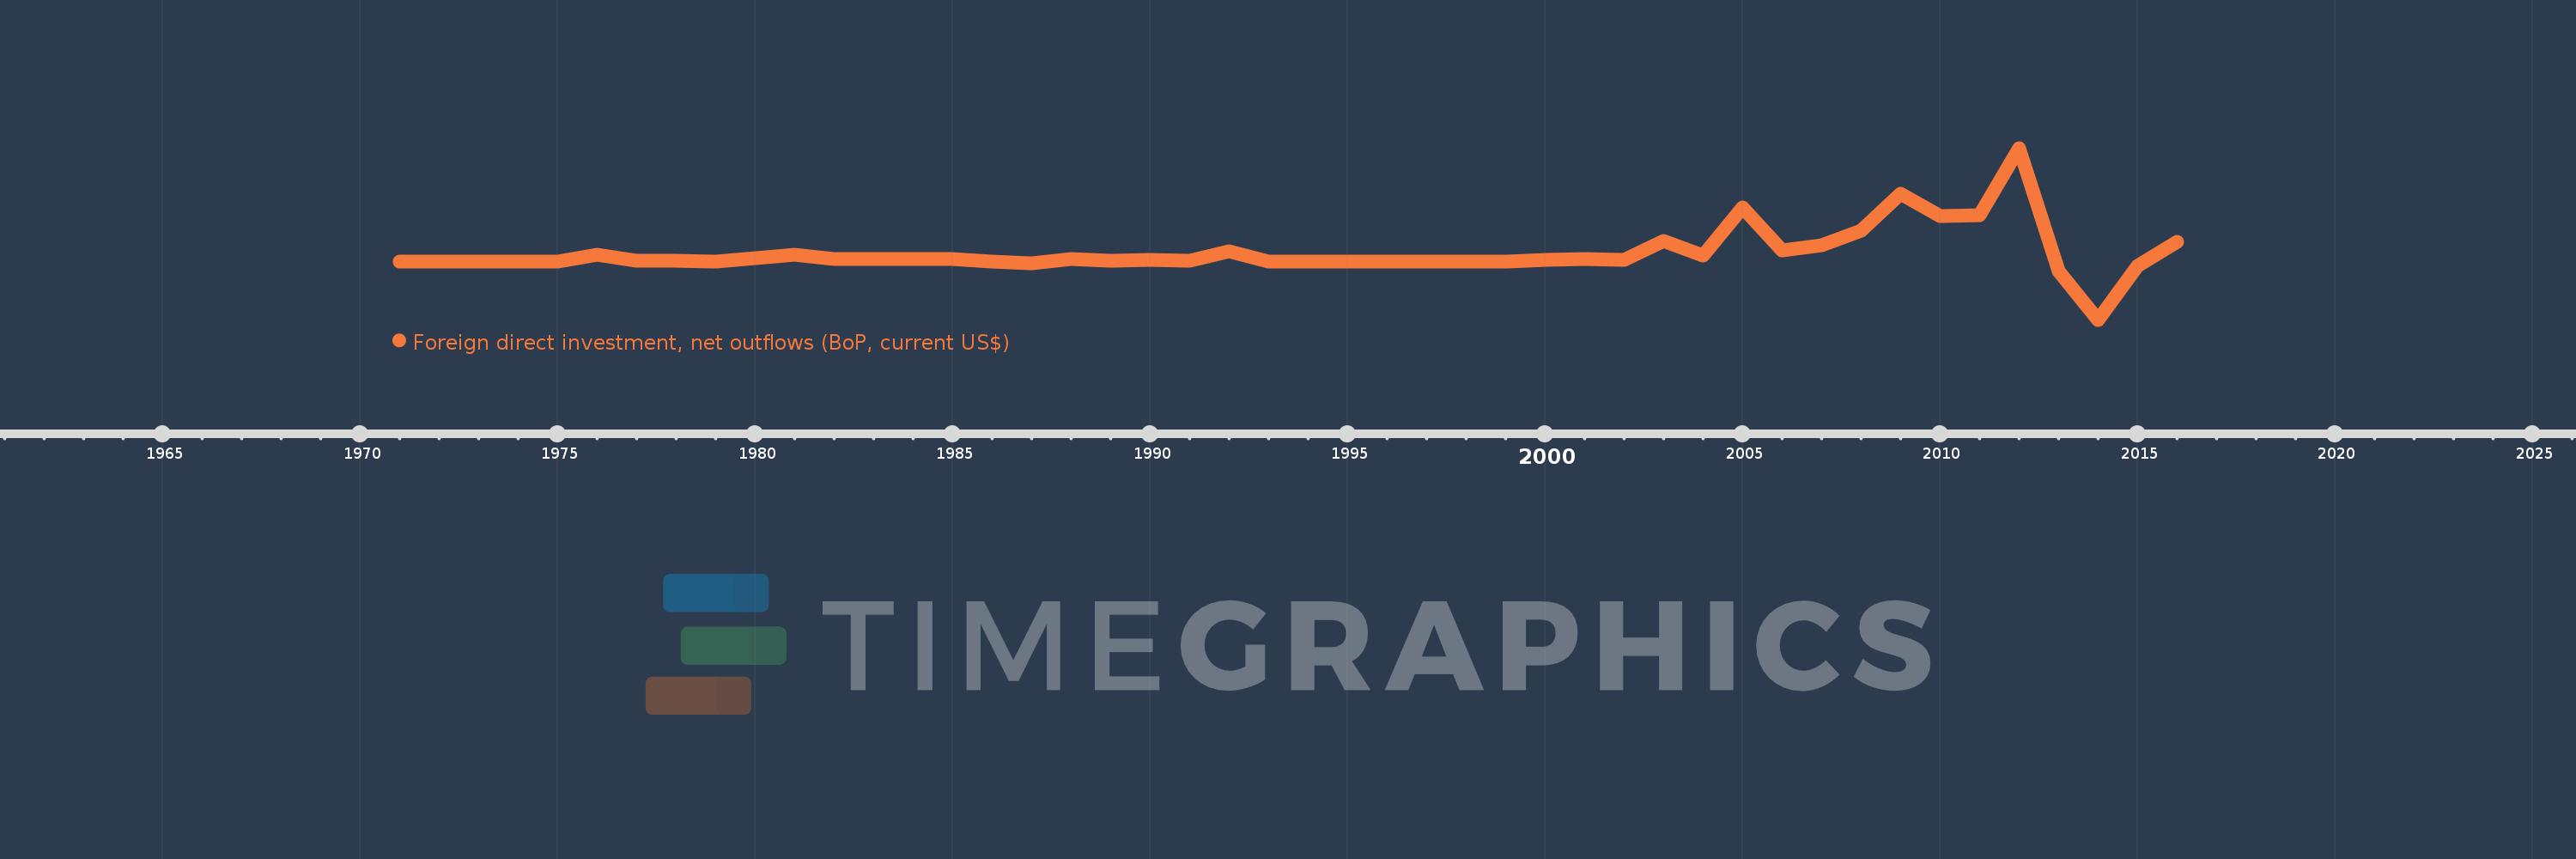
Foreign direct investment, net outflows (BoP, current US$)
2016,2015,2014,2013,2012,2011,2010,2009,2008,2007,2006,2005,2004,2003,2002,2001,2000,1999,1998,1997,1996,1995,1994,1993,1992,1991,1990,1989,1988,1987,1986,1985,1984,1983,1982,1981,1980,1979,1978,1977,1976,1975,1974,1973,1972,1971
This statistics in other country:
AfghanistanAlbaniaAlgeriaAngolaAntigua and BarbudaArab WorldArgentinaArmeniaArubaAustraliaAustriaAzerbaijanBahamas, TheBahrainBangladeshBarbadosBelarusBelgiumBelizeBeninBermudaBoliviaBosnia and HerzegovinaBotswanaBrazilBritish Virgin IslandsBrunei DarussalamBulgariaBurkina FasoBurundiCabo VerdeCambodiaCameroonCanadaCaribbean small statesCayman IslandsCentral African RepublicCentral Europe and the BalticsChadChileChinaColombiaComorosCongo, Dem. Rep.Congo, Rep.Costa RicaCote d'IvoireCroatiaCuracaoCyprusCzech RepublicDenmarkDominicaDominican RepublicEarly-demographic dividendEast Asia & PacificEast Asia & Pacific (excluding high income)East Asia & Pacific (IDA & IBRD countries)EcuadorEgypt, Arab Rep.El SalvadorEquatorial GuineaEritreaEstoniaEuro areaEurope & Central AsiaEurope & Central Asia (excluding high income)Europe & Central Asia (IDA & IBRD countries)European UnionFijiFinlandFragile and conflict affected situationsFranceFrench PolynesiaGabonGambia, TheGeorgiaGermanyGhanaGreeceGrenadaGuatemalaGuineaGuinea-BissauGuyanaHaitiHeavily indebted poor countries (HIPC)High incomeHondurasHong Kong SAR, ChinaHungaryIBRD onlyIcelandIDA & IBRD totalIDA blendIDA onlyIDA totalIndiaIndonesiaIran, Islamic Rep.IraqIrelandIsraelItalyJamaicaJapanJordanKazakhstanKenyaKiribatiKorea, Dem. People’s Rep.Korea, Rep.KosovoKuwaitKyrgyz RepublicLao PDRLate-demographic dividendLatin America & Caribbean Latin America & Caribbean (excluding high income)Latin America & the Caribbean (IDA & IBRD countries)LatviaLeast developed countries: UN classificationLebanonLesothoLiberiaLibyaLithuaniaLow & middle incomeLow incomeLower middle incomeLuxembourgMacao SAR, ChinaMacedonia, FYRMadagascarMalawiMalaysiaMaliMaltaMarshall IslandsMauritaniaMauritiusMexicoMicronesia, Fed. Sts.Middle East & North AfricaMiddle East & North Africa (excluding high income)Middle East & North Africa (IDA & IBRD countries)Middle incomeMoldovaMongoliaMontenegroMoroccoMozambiqueNamibiaNauruNetherlandsNew CaledoniaNew ZealandNicaraguaNigerNigeriaNorth AmericaNorthern Mariana IslandsNorwayOECD membersOmanOther small statesPacific island small statesPakistanPalauPanamaPapua New GuineaParaguayPeruPhilippinesPolandPortugalPost-demographic dividendPre-demographic dividendQatarRomaniaRussian FederationRwandaSamoaSao Tome and PrincipeSaudi ArabiaSenegalSerbiaSeychellesSierra LeoneSingaporeSint Maarten (Dutch part)Slovak RepublicSloveniaSmall statesSolomon IslandsSouth AfricaSouth AsiaSouth Asia (IDA & IBRD)SpainSri LankaSt. Kitts and NevisSt. LuciaSt. Vincent and the GrenadinesSub-Saharan Africa Sub-Saharan Africa (excluding high income)Sub-Saharan Africa (IDA & IBRD countries)SurinameSwazilandSwedenSwitzerlandSyrian Arab RepublicTajikistanTanzaniaThailandTimor-LesteTogoTongaTrinidad and TobagoTunisiaTurkeyUgandaUkraineUnited Arab EmiratesUnited KingdomUnited StatesUpper middle incomeUruguayVanuatuVenezuela, RBVietnamWest Bank and GazaWorldYemen, Rep.ZambiaZimbabwe Timeline:
This timeline shows a graph from 1971 to 2016 of Algeria. No data until 1970. Number of actual observations by date: 46.
Source name:
World Development Indicators
Source organization:
International Monetary Fund, Balance of Payments database, supplemented by data from the United Nations Conference on Trade and Development and official national sources.
Categories, topics:
Economy & Growth, Financial Sector
Last updated:
apr 23, 2017
Indicators value changes by year
Minimum:
-271.748 mln
jan 1, 2014
Maximum:
533.918 mln
jan 1, 2012
At the date of observation
Value
Absolute change
Change from previous value
jan 1, 1971
2.0 mln
+2.0 mln
0.0%
jan 1, 1972
1000.0K
-1000.0K
-50.0%
jan 1, 1973
2.0 mln
+1000.0K
100.0%
jan 1, 1974
1000.0K
-1000.0K
-50.0%
jan 1, 1975
0.0
-1000.0K
-100.0%
jan 1, 1976
34.0 mln
+34.0 mln
%
jan 1, 1977
3.0 mln
-31.0 mln
-91.18%
jan 1, 1978
5.547 mln
+2.547 mln
84.88%
jan 1, 1979
252.15K
-5.294 mln
-95.45%
jan 1, 1980
15.571 mln
+15.319 mln
6.08K%
jan 1, 1981
33.616 mln
+18.045 mln
115.89%
jan 1, 1982
14.597 mln
-19.019 mln
-56.58%
jan 1, 1983
11.324 mln
-3.274 mln
-22.43%
jan 1, 1984
14.617 mln
+3.294 mln
29.09%
jan 1, 1985
14.649 mln
+31.266K
0.21%
jan 1, 1986
2.387 mln
-12.262 mln
-83.71%
jan 1, 1987
-5.317 mln
-7.703 mln
-322.75%
jan 1, 1988
15.052 mln
+20.369 mln
-383.12%
jan 1, 1989
4.903 mln
-10.149 mln
-67.43%
jan 1, 1990
8.149 mln
+3.246 mln
66.2%
jan 1, 1991
4.689 mln
-3.46 mln
-42.46%
jan 1, 1992
50.29 mln
+45.601 mln
972.55%
jan 1, 1993
1000.0
-50.289 mln
-100.0%
jan 1, 1994
1000.0
0.0
0.0%
jan 1, 1995
1000.0
0.0
0.0%
jan 1, 1996
1000.0
0.0
0.0%
jan 1, 1997
1000.0
0.0
0.0%
jan 1, 1998
1000.0
0.0
0.0%
jan 1, 1999
1000.0K
+999.0K
99.9K%
jan 1, 2000
7.6 mln
+6.6 mln
660.0%
jan 1, 2001
13.7 mln
+6.1 mln
80.26%
jan 1, 2002
9.3 mln
-4.4 mln
-32.12%
jan 1, 2003
98.6 mln
+89.3 mln
960.22%
jan 1, 2004
28.0 mln
-70.6 mln
-71.6%
jan 1, 2005
253.0 mln
+225.0 mln
803.57%
jan 1, 2006
55.0 mln
-198.0 mln
-78.26%
jan 1, 2007
79.0 mln
+24.0 mln
43.64%
jan 1, 2008
146.991 mln
+67.991 mln
86.07%
jan 1, 2009
317.852 mln
+170.861 mln
116.24%
jan 1, 2010
214.423 mln
-103.429 mln
-32.54%
jan 1, 2011
219.233 mln
+4.81 mln
2.24%
jan 1, 2012
533.918 mln
+314.685 mln
143.54%
jan 1, 2013
-41.442 mln
-575.36 mln
-107.76%
jan 1, 2014
-271.748 mln
-230.306 mln
555.73%
jan 1, 2015
-18.439 mln
+253.31 mln
-93.21%
jan 1, 2016
95.537 mln
+113.976 mln
-618.14%
Ranking of countries by current statistics by years


Comments: