29
/
en
AIzaSyAYiBZKx7MnpbEhh9jyipgxe19OcubqV5w
April 1, 2024
223548
Philippines
PHL
true
2
1
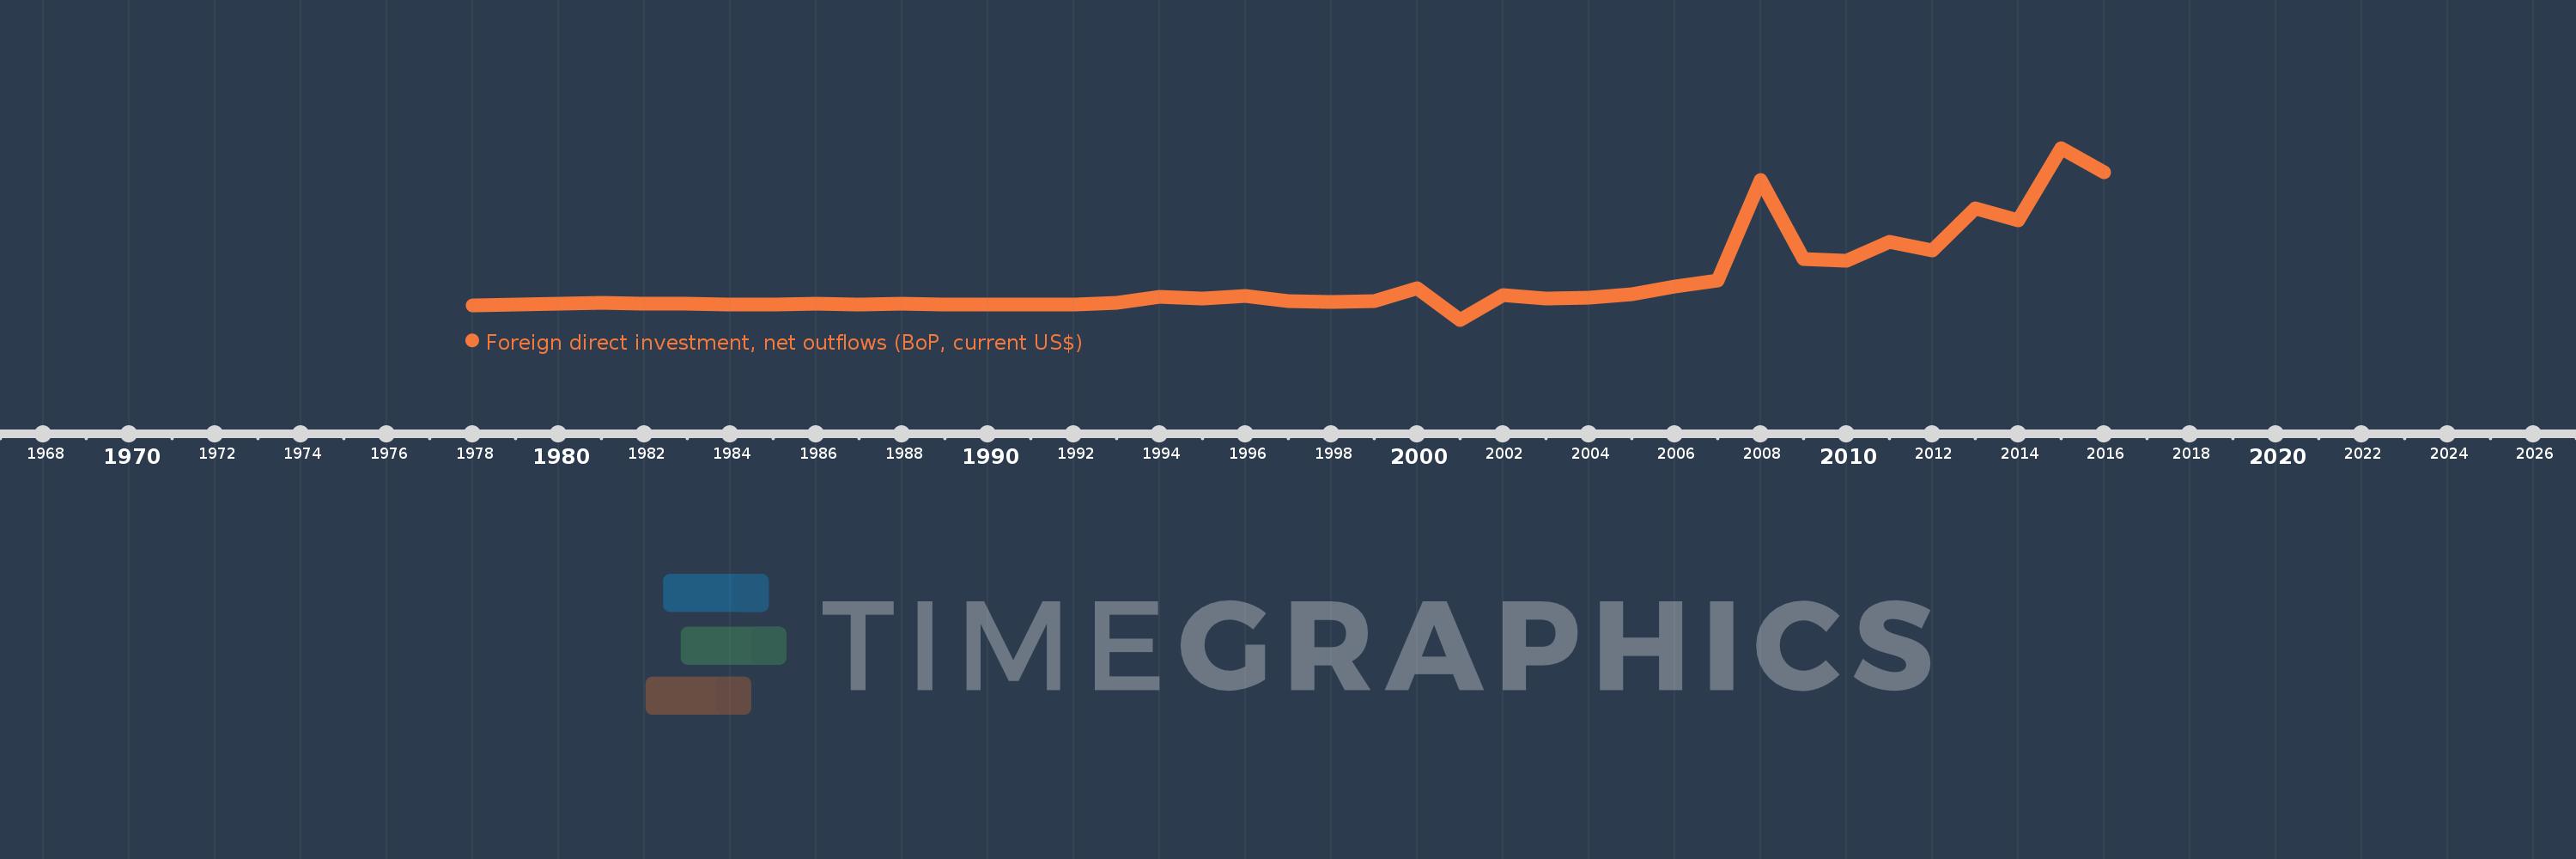
Foreign direct investment, net outflows (BoP, current US$)
2016,2015,2014,2013,2012,2011,2010,2009,2008,2007,2006,2005,2004,2003,2002,2001,2000,1999,1998,1997,1996,1995,1994,1993,1992,1991,1990,1989,1988,1987,1986,1985,1984,1983,1982,1981,1978
This statistics in other country:
AfghanistanAlbaniaAlgeriaAngolaAntigua and BarbudaArab WorldArgentinaArmeniaArubaAustraliaAustriaAzerbaijanBahamas, TheBahrainBangladeshBarbadosBelarusBelgiumBelizeBeninBermudaBoliviaBosnia and HerzegovinaBotswanaBrazilBritish Virgin IslandsBrunei DarussalamBulgariaBurkina FasoBurundiCabo VerdeCambodiaCameroonCanadaCaribbean small statesCayman IslandsCentral African RepublicCentral Europe and the BalticsChadChileChinaColombiaComorosCongo, Dem. Rep.Congo, Rep.Costa RicaCote d'IvoireCroatiaCuracaoCyprusCzech RepublicDenmarkDominicaDominican RepublicEarly-demographic dividendEast Asia & PacificEast Asia & Pacific (excluding high income)East Asia & Pacific (IDA & IBRD countries)EcuadorEgypt, Arab Rep.El SalvadorEquatorial GuineaEritreaEstoniaEuro areaEurope & Central AsiaEurope & Central Asia (excluding high income)Europe & Central Asia (IDA & IBRD countries)European UnionFijiFinlandFragile and conflict affected situationsFranceFrench PolynesiaGabonGambia, TheGeorgiaGermanyGhanaGreeceGrenadaGuatemalaGuineaGuinea-BissauGuyanaHaitiHeavily indebted poor countries (HIPC)High incomeHondurasHong Kong SAR, ChinaHungaryIBRD onlyIcelandIDA & IBRD totalIDA blendIDA onlyIDA totalIndiaIndonesiaIran, Islamic Rep.IraqIrelandIsraelItalyJamaicaJapanJordanKazakhstanKenyaKiribatiKorea, Dem. People’s Rep.Korea, Rep.KosovoKuwaitKyrgyz RepublicLao PDRLate-demographic dividendLatin America & Caribbean Latin America & Caribbean (excluding high income)Latin America & the Caribbean (IDA & IBRD countries)LatviaLeast developed countries: UN classificationLebanonLesothoLiberiaLibyaLithuaniaLow & middle incomeLow incomeLower middle incomeLuxembourgMacao SAR, ChinaMacedonia, FYRMadagascarMalawiMalaysiaMaliMaltaMarshall IslandsMauritaniaMauritiusMexicoMicronesia, Fed. Sts.Middle East & North AfricaMiddle East & North Africa (excluding high income)Middle East & North Africa (IDA & IBRD countries)Middle incomeMoldovaMongoliaMontenegroMoroccoMozambiqueNamibiaNauruNetherlandsNew CaledoniaNew ZealandNicaraguaNigerNigeriaNorth AmericaNorthern Mariana IslandsNorwayOECD membersOmanOther small statesPacific island small statesPakistanPalauPanamaPapua New GuineaParaguayPeruPhilippinesPolandPortugalPost-demographic dividendPre-demographic dividendQatarRomaniaRussian FederationRwandaSamoaSao Tome and PrincipeSaudi ArabiaSenegalSerbiaSeychellesSierra LeoneSingaporeSint Maarten (Dutch part)Slovak RepublicSloveniaSmall statesSolomon IslandsSouth AfricaSouth AsiaSouth Asia (IDA & IBRD)SpainSri LankaSt. Kitts and NevisSt. LuciaSt. Vincent and the GrenadinesSub-Saharan Africa Sub-Saharan Africa (excluding high income)Sub-Saharan Africa (IDA & IBRD countries)SurinameSwazilandSwedenSwitzerlandSyrian Arab RepublicTajikistanTanzaniaThailandTimor-LesteTogoTongaTrinidad and TobagoTunisiaTurkeyUgandaUkraineUnited Arab EmiratesUnited KingdomUnited StatesUpper middle incomeUruguayVanuatuVenezuela, RBVietnamWest Bank and GazaWorldYemen, Rep.ZambiaZimbabwe Timeline:
This timeline shows a graph from 1978 to 2016 of Philippines. No data until 1977. Number of actual observations by date: 37.
Source name:
World Development Indicators
Source organization:
International Monetary Fund, Balance of Payments database, supplemented by data from the United Nations Conference on Trade and Development and official national sources.
Categories, topics:
Economy & Growth, Financial Sector
Last updated:
apr 23, 2017
Indicators value changes by year
Minimum:
-628.0 mln
jan 1, 2001
Maximum:
6.754 bln
jan 1, 2015
At the date of observation
Value
Absolute change
Change from previous value
jan 1, 1978
1000.0K
+1000.0K
0.0%
jan 1, 1981
86.0 mln
+85.0 mln
8.5K%
jan 1, 1982
47.0 mln
-39.0 mln
-45.35%
jan 1, 1983
61.0 mln
+14.0 mln
29.79%
jan 1, 1984
27.0 mln
-34.0 mln
-55.74%
jan 1, 1985
15.0 mln
-12.0 mln
-44.44%
jan 1, 1986
58.0 mln
+43.0 mln
286.67%
jan 1, 1987
11.0 mln
-47.0 mln
-81.03%
jan 1, 1988
53.0 mln
+42.0 mln
381.82%
jan 1, 1989
16.0 mln
-37.0 mln
-69.81%
jan 1, 1990
9.0 mln
-7.0 mln
-43.75%
jan 1, 1991
22.0 mln
+13.0 mln
144.44%
jan 1, 1992
27.0 mln
+5.0 mln
22.73%
jan 1, 1993
101.0 mln
+74.0 mln
274.07%
jan 1, 1994
374.0 mln
+273.0 mln
270.3%
jan 1, 1995
302.0 mln
-72.0 mln
-19.25%
jan 1, 1996
399.0 mln
+97.0 mln
32.12%
jan 1, 1997
182.0 mln
-217.0 mln
-54.39%
jan 1, 1998
136.0 mln
-46.0 mln
-25.27%
jan 1, 1999
160.0 mln
+24.0 mln
17.65%
jan 1, 2000
715.0 mln
+555.0 mln
346.88%
jan 1, 2001
-628.0 mln
-1.343 bln
-187.83%
jan 1, 2002
425.0 mln
+1.053 bln
-167.68%
jan 1, 2003
292.0 mln
-133.0 mln
-31.29%
jan 1, 2004
304.0 mln
+12.0 mln
4.11%
jan 1, 2005
483.0 mln
+179.0 mln
58.88%
jan 1, 2006
794.117 mln
+311.117 mln
64.41%
jan 1, 2007
1.068 bln
+274.195 mln
34.53%
jan 1, 2008
5.373 bln
+4.304 bln
402.91%
jan 1, 2009
1.97 bln
-3.403 bln
-63.33%
jan 1, 2010
1.897 bln
-72.905 mln
-3.7%
jan 1, 2011
2.712 bln
+815.037 mln
42.96%
jan 1, 2012
2.35 bln
-362.525 mln
-13.37%
jan 1, 2013
4.173 bln
+1.824 bln
77.61%
jan 1, 2014
3.647 bln
-526.271 mln
-12.61%
jan 1, 2015
6.754 bln
+3.107 bln
85.19%
jan 1, 2016
5.7 bln
-1.054 bln
-15.61%
Ranking of countries by current statistics by years


Comments: