29
/
en
AIzaSyAYiBZKx7MnpbEhh9jyipgxe19OcubqV5w
April 1, 2024
29848
Euro area
EMU
false
2
1
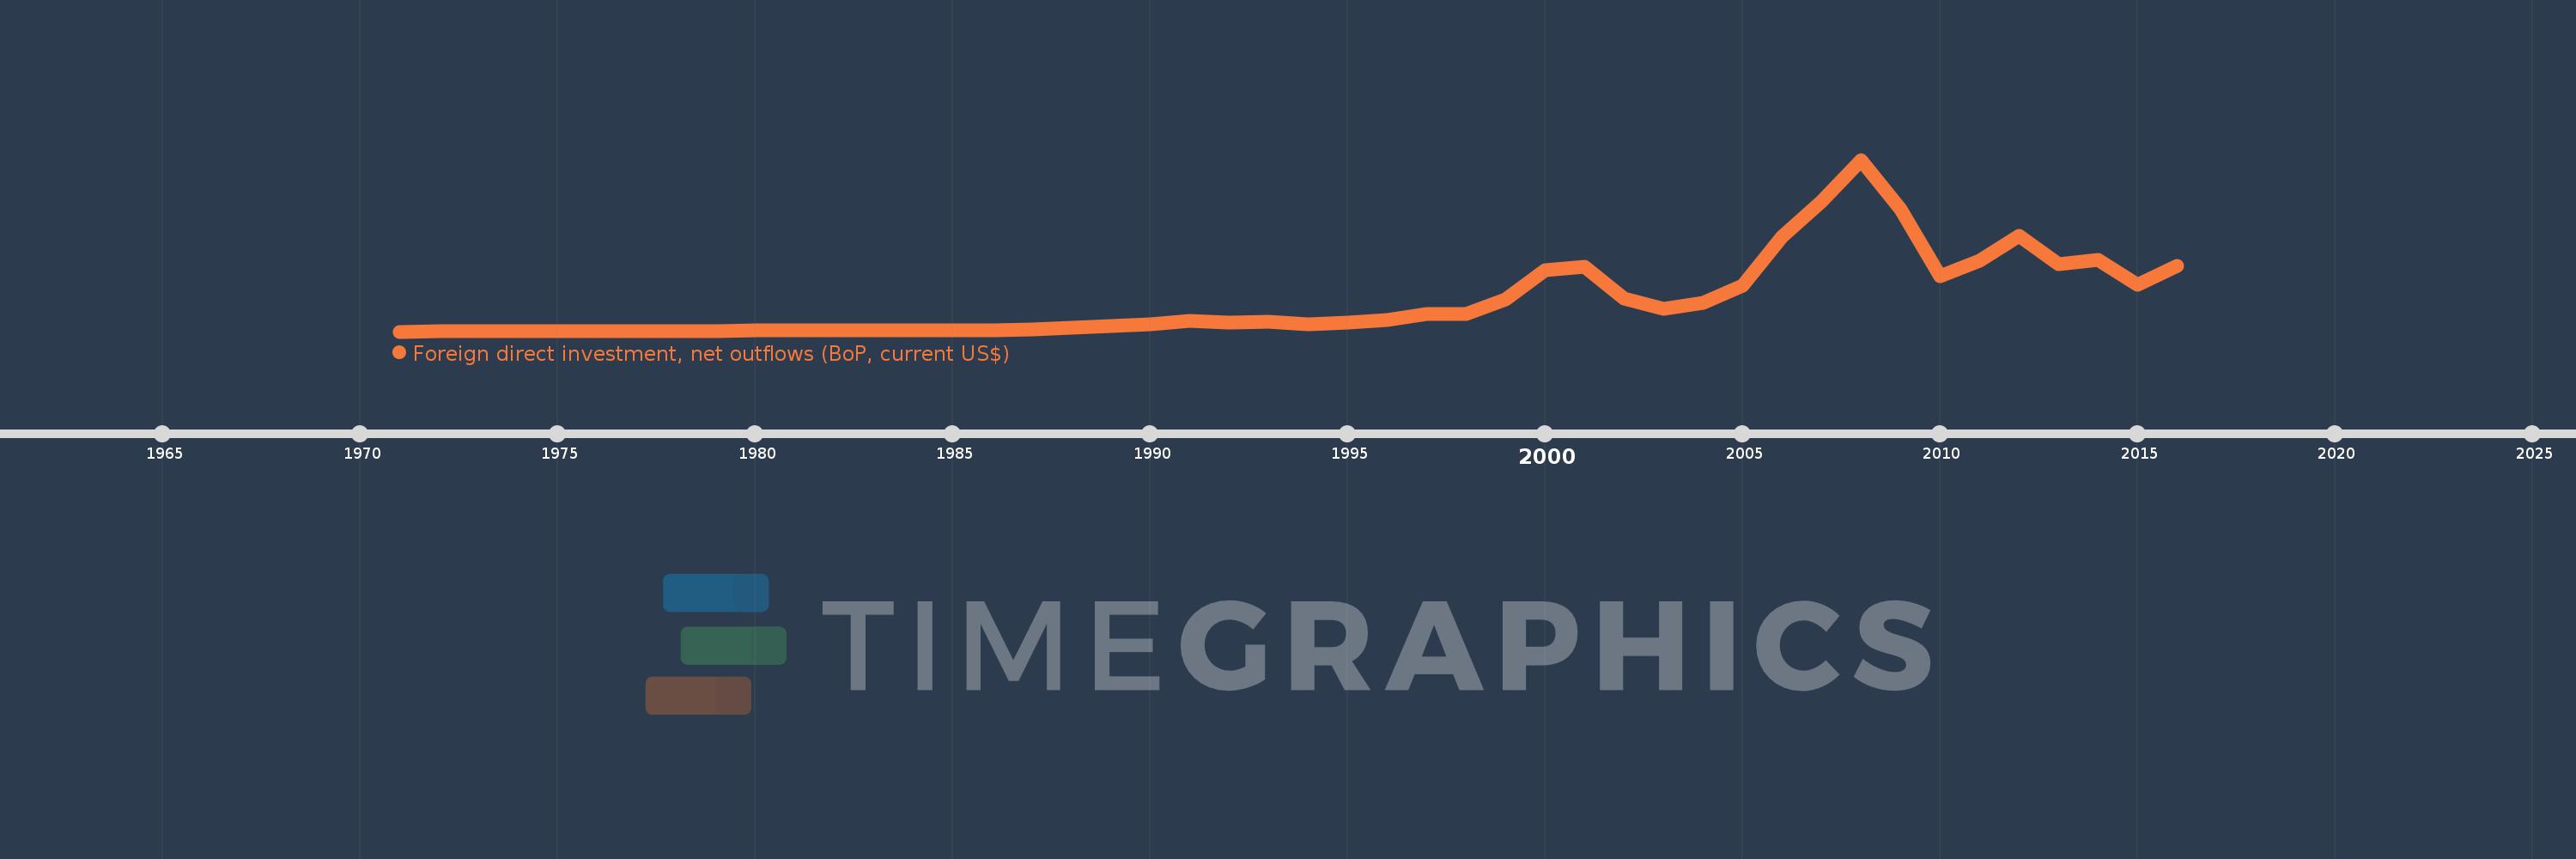
Foreign direct investment, net outflows (BoP, current US$)
2016,2015,2014,2013,2012,2011,2010,2009,2008,2007,2006,2005,2004,2003,2002,2001,2000,1999,1998,1997,1996,1995,1994,1993,1992,1991,1990,1989,1988,1987,1986,1985,1984,1983,1982,1981,1980,1979,1978,1977,1976,1975,1974,1973,1972,1971
This statistics in other country:
AfghanistanAlbaniaAlgeriaAngolaAntigua and BarbudaArab WorldArgentinaArmeniaArubaAustraliaAustriaAzerbaijanBahamas, TheBahrainBangladeshBarbadosBelarusBelgiumBelizeBeninBermudaBoliviaBosnia and HerzegovinaBotswanaBrazilBritish Virgin IslandsBrunei DarussalamBulgariaBurkina FasoBurundiCabo VerdeCambodiaCameroonCanadaCaribbean small statesCayman IslandsCentral African RepublicCentral Europe and the BalticsChadChileChinaColombiaComorosCongo, Dem. Rep.Congo, Rep.Costa RicaCote d'IvoireCroatiaCuracaoCyprusCzech RepublicDenmarkDominicaDominican RepublicEarly-demographic dividendEast Asia & PacificEast Asia & Pacific (excluding high income)East Asia & Pacific (IDA & IBRD countries)EcuadorEgypt, Arab Rep.El SalvadorEquatorial GuineaEritreaEstoniaEuro areaEurope & Central AsiaEurope & Central Asia (excluding high income)Europe & Central Asia (IDA & IBRD countries)European UnionFijiFinlandFragile and conflict affected situationsFranceFrench PolynesiaGabonGambia, TheGeorgiaGermanyGhanaGreeceGrenadaGuatemalaGuineaGuinea-BissauGuyanaHaitiHeavily indebted poor countries (HIPC)High incomeHondurasHong Kong SAR, ChinaHungaryIBRD onlyIcelandIDA & IBRD totalIDA blendIDA onlyIDA totalIndiaIndonesiaIran, Islamic Rep.IraqIrelandIsraelItalyJamaicaJapanJordanKazakhstanKenyaKiribatiKorea, Dem. People’s Rep.Korea, Rep.KosovoKuwaitKyrgyz RepublicLao PDRLate-demographic dividendLatin America & Caribbean Latin America & Caribbean (excluding high income)Latin America & the Caribbean (IDA & IBRD countries)LatviaLeast developed countries: UN classificationLebanonLesothoLiberiaLibyaLithuaniaLow & middle incomeLow incomeLower middle incomeLuxembourgMacao SAR, ChinaMacedonia, FYRMadagascarMalawiMalaysiaMaliMaltaMarshall IslandsMauritaniaMauritiusMexicoMicronesia, Fed. Sts.Middle East & North AfricaMiddle East & North Africa (excluding high income)Middle East & North Africa (IDA & IBRD countries)Middle incomeMoldovaMongoliaMontenegroMoroccoMozambiqueNamibiaNauruNetherlandsNew CaledoniaNew ZealandNicaraguaNigerNigeriaNorth AmericaNorthern Mariana IslandsNorwayOECD membersOmanOther small statesPacific island small statesPakistanPalauPanamaPapua New GuineaParaguayPeruPhilippinesPolandPortugalPost-demographic dividendPre-demographic dividendQatarRomaniaRussian FederationRwandaSamoaSao Tome and PrincipeSaudi ArabiaSenegalSerbiaSeychellesSierra LeoneSingaporeSint Maarten (Dutch part)Slovak RepublicSloveniaSmall statesSolomon IslandsSouth AfricaSouth AsiaSouth Asia (IDA & IBRD)SpainSri LankaSt. Kitts and NevisSt. LuciaSt. Vincent and the GrenadinesSub-Saharan Africa Sub-Saharan Africa (excluding high income)Sub-Saharan Africa (IDA & IBRD countries)SurinameSwazilandSwedenSwitzerlandSyrian Arab RepublicTajikistanTanzaniaThailandTimor-LesteTogoTongaTrinidad and TobagoTunisiaTurkeyUgandaUkraineUnited Arab EmiratesUnited KingdomUnited StatesUpper middle incomeUruguayVanuatuVenezuela, RBVietnamWest Bank and GazaWorldYemen, Rep.ZambiaZimbabwe Timeline:
This timeline shows a graph from 1971 to 2016 of Euro area. No data until 1970. Number of actual observations by date: 46.
Source name:
World Development Indicators
Source organization:
International Monetary Fund, Balance of Payments database, supplemented by data from the United Nations Conference on Trade and Development and official national sources.
Categories, topics:
Economy & Growth, Financial Sector
Last updated:
apr 23, 2017
Indicators value changes by year
Minimum:
3.144 bln
jan 1, 1971
Maximum:
1.452 trl
jan 1, 2008
At the date of observation
Value
Absolute change
Change from previous value
jan 1, 1971
3.144 bln
+3.144 bln
0.0%
jan 1, 1972
3.586 bln
+441.841 mln
14.05%
jan 1, 1973
4.542 bln
+956.036 mln
26.66%
jan 1, 1974
5.712 bln
+1.17 bln
25.76%
jan 1, 1975
6.544 bln
+832.215 mln
14.57%
jan 1, 1976
6.849 bln
+305.164 mln
4.66%
jan 1, 1977
7.396 bln
+546.966 mln
7.99%
jan 1, 1978
7.75 bln
+354.295 mln
4.79%
jan 1, 1979
10.206 bln
+2.456 bln
31.68%
jan 1, 1980
15.499 bln
+5.293 bln
51.86%
jan 1, 1981
14.672 bln
-827.024 mln
-5.34%
jan 1, 1982
14.971 bln
+299.284 mln
2.04%
jan 1, 1983
10.468 bln
-4.503 bln
-30.08%
jan 1, 1984
11.459 bln
+990.942 mln
9.47%
jan 1, 1985
14.684 bln
+3.225 bln
28.14%
jan 1, 1986
13.144 bln
-1.54 bln
-10.49%
jan 1, 1987
24.56 bln
+11.417 bln
86.86%
jan 1, 1988
33.321 bln
+8.761 bln
35.67%
jan 1, 1989
47.039 bln
+13.718 bln
41.17%
jan 1, 1990
63.208 bln
+16.169 bln
34.37%
jan 1, 1991
94.871 bln
+31.663 bln
50.09%
jan 1, 1992
80.22 bln
-14.65 bln
-15.44%
jan 1, 1993
83.04 bln
+2.82 bln
3.51%
jan 1, 1994
67.663 bln
-15.377 bln
-18.52%
jan 1, 1995
77.234 bln
+9.571 bln
14.14%
jan 1, 1996
104.17 bln
+26.936 bln
34.88%
jan 1, 1997
153.792 bln
+49.622 bln
47.64%
jan 1, 1998
153.286 bln
-505.962 mln
-0.33%
jan 1, 1999
275.877 bln
+122.592 bln
79.98%
jan 1, 2000
518.064 bln
+242.187 bln
87.79%
jan 1, 2001
552.626 bln
+34.561 bln
6.67%
jan 1, 2002
284.929 bln
-267.697 bln
-48.44%
jan 1, 2003
195.769 bln
-89.159 bln
-31.29%
jan 1, 2004
244.015 bln
+48.246 bln
24.64%
jan 1, 2005
389.699 bln
+145.684 bln
59.7%
jan 1, 2006
803.223 bln
+413.524 bln
106.11%
jan 1, 2007
1.103 trl
+299.49 bln
37.29%
jan 1, 2008
1.452 trl
+349.428 bln
31.69%
jan 1, 2009
1.034 trl
-418.281 bln
-28.8%
jan 1, 2010
466.884 bln
-566.975 bln
-54.84%
jan 1, 2011
599.383 bln
+132.499 bln
28.38%
jan 1, 2012
808.88 bln
+209.496 bln
34.95%
jan 1, 2013
573.639 bln
-235.241 bln
-29.08%
jan 1, 2014
609.114 bln
+35.475 bln
6.18%
jan 1, 2015
397.674 bln
-211.439 bln
-34.71%
jan 1, 2016
560.732 bln
+163.058 bln
41.0%
Ranking of countries by current statistics by years


Comments: