29
/
en
AIzaSyAYiBZKx7MnpbEhh9jyipgxe19OcubqV5w
April 1, 2024
24878
Caribbean small states
CSS
false
2
1
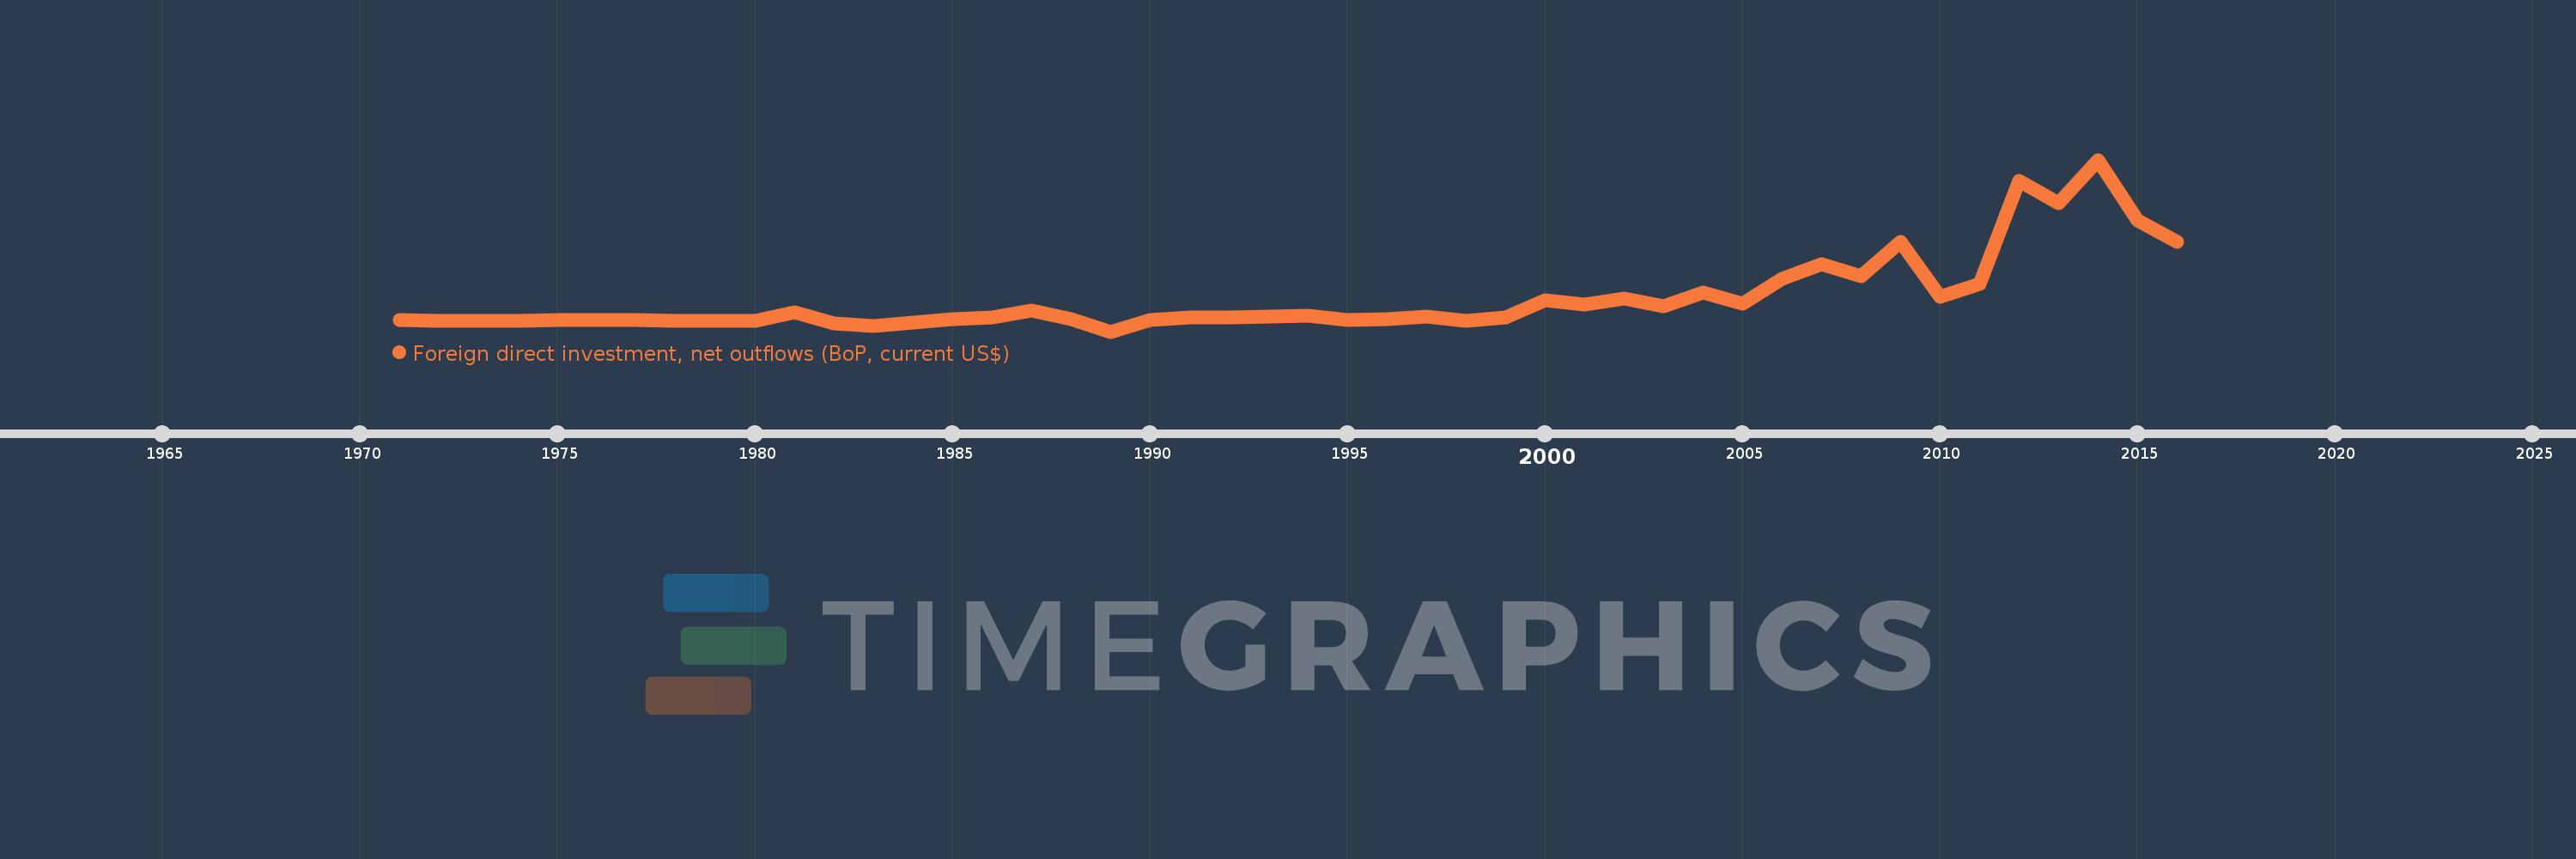
Foreign direct investment, net outflows (BoP, current US$)
2016,2015,2014,2013,2012,2011,2010,2009,2008,2007,2006,2005,2004,2003,2002,2001,2000,1999,1998,1997,1996,1995,1994,1993,1992,1991,1990,1989,1988,1987,1986,1985,1984,1983,1982,1981,1980,1979,1978,1977,1976,1975,1974,1973,1972,1971
This statistics in other country:
AfghanistanAlbaniaAlgeriaAngolaAntigua and BarbudaArab WorldArgentinaArmeniaArubaAustraliaAustriaAzerbaijanBahamas, TheBahrainBangladeshBarbadosBelarusBelgiumBelizeBeninBermudaBoliviaBosnia and HerzegovinaBotswanaBrazilBritish Virgin IslandsBrunei DarussalamBulgariaBurkina FasoBurundiCabo VerdeCambodiaCameroonCanadaCaribbean small statesCayman IslandsCentral African RepublicCentral Europe and the BalticsChadChileChinaColombiaComorosCongo, Dem. Rep.Congo, Rep.Costa RicaCote d'IvoireCroatiaCuracaoCyprusCzech RepublicDenmarkDominicaDominican RepublicEarly-demographic dividendEast Asia & PacificEast Asia & Pacific (excluding high income)East Asia & Pacific (IDA & IBRD countries)EcuadorEgypt, Arab Rep.El SalvadorEquatorial GuineaEritreaEstoniaEuro areaEurope & Central AsiaEurope & Central Asia (excluding high income)Europe & Central Asia (IDA & IBRD countries)European UnionFijiFinlandFragile and conflict affected situationsFranceFrench PolynesiaGabonGambia, TheGeorgiaGermanyGhanaGreeceGrenadaGuatemalaGuineaGuinea-BissauGuyanaHaitiHeavily indebted poor countries (HIPC)High incomeHondurasHong Kong SAR, ChinaHungaryIBRD onlyIcelandIDA & IBRD totalIDA blendIDA onlyIDA totalIndiaIndonesiaIran, Islamic Rep.IraqIrelandIsraelItalyJamaicaJapanJordanKazakhstanKenyaKiribatiKorea, Dem. People’s Rep.Korea, Rep.KosovoKuwaitKyrgyz RepublicLao PDRLate-demographic dividendLatin America & Caribbean Latin America & Caribbean (excluding high income)Latin America & the Caribbean (IDA & IBRD countries)LatviaLeast developed countries: UN classificationLebanonLesothoLiberiaLibyaLithuaniaLow & middle incomeLow incomeLower middle incomeLuxembourgMacao SAR, ChinaMacedonia, FYRMadagascarMalawiMalaysiaMaliMaltaMarshall IslandsMauritaniaMauritiusMexicoMicronesia, Fed. Sts.Middle East & North AfricaMiddle East & North Africa (excluding high income)Middle East & North Africa (IDA & IBRD countries)Middle incomeMoldovaMongoliaMontenegroMoroccoMozambiqueNamibiaNauruNetherlandsNew CaledoniaNew ZealandNicaraguaNigerNigeriaNorth AmericaNorthern Mariana IslandsNorwayOECD membersOmanOther small statesPacific island small statesPakistanPalauPanamaPapua New GuineaParaguayPeruPhilippinesPolandPortugalPost-demographic dividendPre-demographic dividendQatarRomaniaRussian FederationRwandaSamoaSao Tome and PrincipeSaudi ArabiaSenegalSerbiaSeychellesSierra LeoneSingaporeSint Maarten (Dutch part)Slovak RepublicSloveniaSmall statesSolomon IslandsSouth AfricaSouth AsiaSouth Asia (IDA & IBRD)SpainSri LankaSt. Kitts and NevisSt. LuciaSt. Vincent and the GrenadinesSub-Saharan Africa Sub-Saharan Africa (excluding high income)Sub-Saharan Africa (IDA & IBRD countries)SurinameSwazilandSwedenSwitzerlandSyrian Arab RepublicTajikistanTanzaniaThailandTimor-LesteTogoTongaTrinidad and TobagoTunisiaTurkeyUgandaUkraineUnited Arab EmiratesUnited KingdomUnited StatesUpper middle incomeUruguayVanuatuVenezuela, RBVietnamWest Bank and GazaWorldYemen, Rep.ZambiaZimbabwe Timeline:
This timeline shows a graph from 1971 to 2016 of Caribbean small states. No data until 1970. Number of actual observations by date: 46.
Source name:
World Development Indicators
Source organization:
International Monetary Fund, Balance of Payments database, supplemented by data from the United Nations Conference on Trade and Development and official national sources.
Categories, topics:
Economy & Growth, Financial Sector
Last updated:
apr 23, 2017
Indicators value changes by year
Minimum:
-160.808 mln
jan 1, 1989
Maximum:
2.321 bln
jan 1, 2014
At the date of observation
Value
Absolute change
Change from previous value
jan 1, 1971
1.2 mln
+1.2 mln
0.0%
jan 1, 1972
316.538K
-883.462K
-73.62%
jan 1, 1973
-52.049K
-368.587K
-116.44%
jan 1, 1974
-1.183 mln
-1.131 mln
2.17K%
jan 1, 1975
7.146 mln
+8.329 mln
-703.89%
jan 1, 1976
792.524K
-6.354 mln
-88.91%
jan 1, 1977
950.0K
+157.476K
19.87%
jan 1, 1978
400.0K
-550.0K
-57.89%
jan 1, 1979
-50.0K
-450.0K
-112.5%
jan 1, 1980
250.0K
+300.0K
-600.0%
jan 1, 1981
115.6 mln
+115.35 mln
46.14K%
jan 1, 1982
-36.8 mln
-152.4 mln
-131.83%
jan 1, 1983
-75.5 mln
-38.7 mln
105.16%
jan 1, 1984
-35.975 mln
+39.525 mln
-52.35%
jan 1, 1985
17.858 mln
+53.833 mln
-149.64%
jan 1, 1986
45.43 mln
+27.572 mln
154.39%
jan 1, 1987
143.148 mln
+97.718 mln
215.1%
jan 1, 1988
23.658 mln
-119.491 mln
-83.47%
jan 1, 1989
-160.808 mln
-184.466 mln
-779.72%
jan 1, 1990
4.4 mln
+165.208 mln
-102.74%
jan 1, 1991
40.4 mln
+36.0 mln
818.18%
jan 1, 1992
39.804 mln
-595.521K
-1.47%
jan 1, 1993
54.051 mln
+14.247 mln
35.79%
jan 1, 1994
68.666 mln
+14.615 mln
27.04%
jan 1, 1995
5.558 mln
-63.109 mln
-91.91%
jan 1, 1996
24.729 mln
+19.171 mln
344.96%
jan 1, 1997
53.518 mln
+28.789 mln
116.42%
jan 1, 1998
-6.5 mln
-60.018 mln
-112.15%
jan 1, 1999
41.45 mln
+47.95 mln
-737.69%
jan 1, 2000
294.416 mln
+252.966 mln
610.29%
jan 1, 2001
235.728 mln
-58.687 mln
-19.93%
jan 1, 2002
320.641 mln
+84.913 mln
36.02%
jan 1, 2003
207.459 mln
-113.182 mln
-35.3%
jan 1, 2004
399.342 mln
+191.883 mln
92.49%
jan 1, 2005
245.868 mln
-153.474 mln
-38.43%
jan 1, 2006
598.023 mln
+352.155 mln
143.23%
jan 1, 2007
812.958 mln
+214.935 mln
35.94%
jan 1, 2008
641.848 mln
-171.111 mln
-21.05%
jan 1, 2009
1.141 bln
+499.339 mln
77.8%
jan 1, 2010
345.593 mln
-795.594 mln
-69.72%
jan 1, 2011
523.575 mln
+177.982 mln
51.5%
jan 1, 2012
2.014 bln
+1.491 bln
284.72%
jan 1, 2013
1.698 bln
-315.917 mln
-15.68%
jan 1, 2014
2.321 bln
+622.402 mln
36.65%
jan 1, 2015
1.441 bln
-880.149 mln
-37.92%
jan 1, 2016
1.134 bln
-306.431 mln
-21.27%
Ranking of countries by current statistics by years


Comments: