29
/
en
AIzaSyAYiBZKx7MnpbEhh9jyipgxe19OcubqV5w
April 1, 2024
32598
Europe & Central Asia (IDA & IBRD countries)
TEC
false
2
1
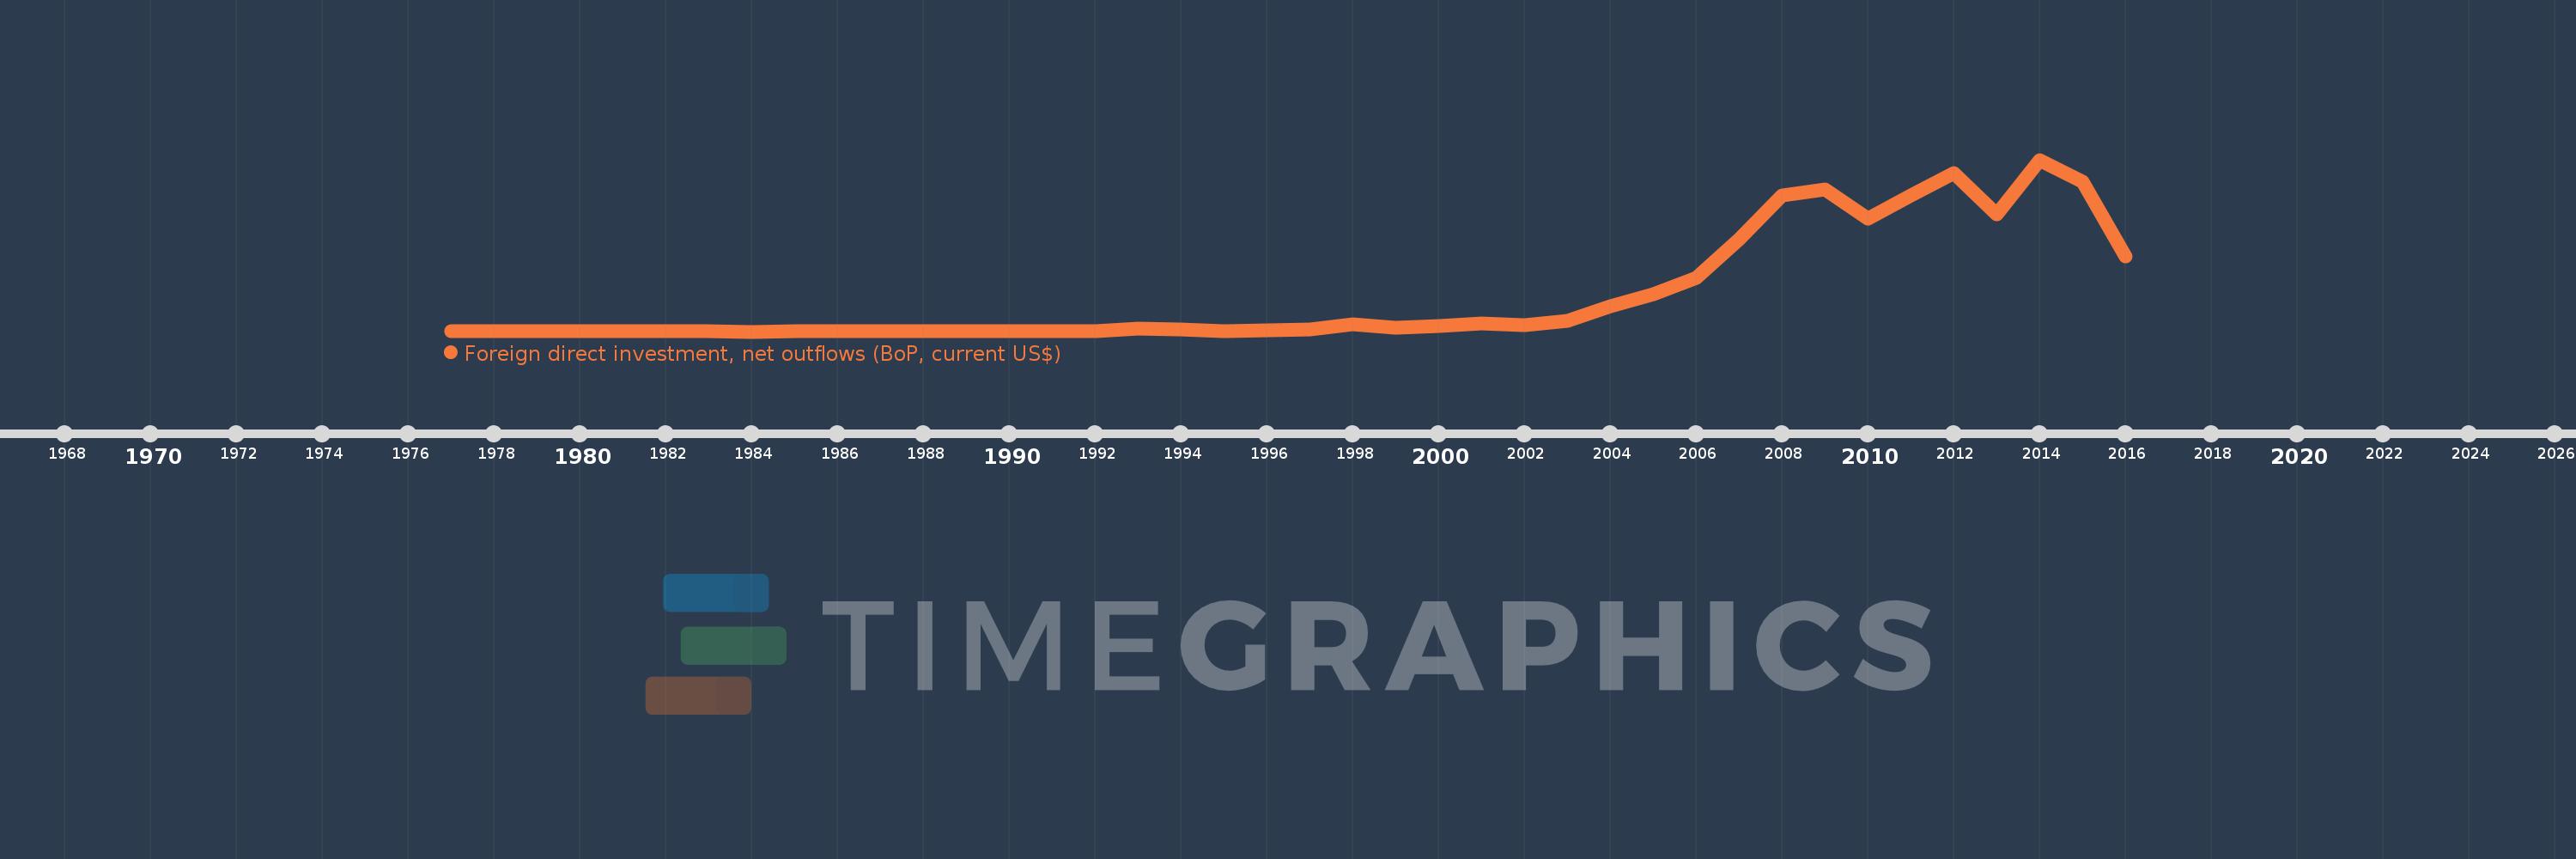
Foreign direct investment, net outflows (BoP, current US$)
2016,2015,2014,2013,2012,2011,2010,2009,2008,2007,2006,2005,2004,2003,2002,2001,2000,1999,1998,1997,1996,1995,1994,1993,1992,1991,1990,1989,1988,1987,1986,1985,1984,1983,1982,1981,1980,1979,1978,1977
This statistics in other country:
AfghanistanAlbaniaAlgeriaAngolaAntigua and BarbudaArab WorldArgentinaArmeniaArubaAustraliaAustriaAzerbaijanBahamas, TheBahrainBangladeshBarbadosBelarusBelgiumBelizeBeninBermudaBoliviaBosnia and HerzegovinaBotswanaBrazilBritish Virgin IslandsBrunei DarussalamBulgariaBurkina FasoBurundiCabo VerdeCambodiaCameroonCanadaCaribbean small statesCayman IslandsCentral African RepublicCentral Europe and the BalticsChadChileChinaColombiaComorosCongo, Dem. Rep.Congo, Rep.Costa RicaCote d'IvoireCroatiaCuracaoCyprusCzech RepublicDenmarkDominicaDominican RepublicEarly-demographic dividendEast Asia & PacificEast Asia & Pacific (excluding high income)East Asia & Pacific (IDA & IBRD countries)EcuadorEgypt, Arab Rep.El SalvadorEquatorial GuineaEritreaEstoniaEuro areaEurope & Central AsiaEurope & Central Asia (excluding high income)Europe & Central Asia (IDA & IBRD countries)European UnionFijiFinlandFragile and conflict affected situationsFranceFrench PolynesiaGabonGambia, TheGeorgiaGermanyGhanaGreeceGrenadaGuatemalaGuineaGuinea-BissauGuyanaHaitiHeavily indebted poor countries (HIPC)High incomeHondurasHong Kong SAR, ChinaHungaryIBRD onlyIcelandIDA & IBRD totalIDA blendIDA onlyIDA totalIndiaIndonesiaIran, Islamic Rep.IraqIrelandIsraelItalyJamaicaJapanJordanKazakhstanKenyaKiribatiKorea, Dem. People’s Rep.Korea, Rep.KosovoKuwaitKyrgyz RepublicLao PDRLate-demographic dividendLatin America & Caribbean Latin America & Caribbean (excluding high income)Latin America & the Caribbean (IDA & IBRD countries)LatviaLeast developed countries: UN classificationLebanonLesothoLiberiaLibyaLithuaniaLow & middle incomeLow incomeLower middle incomeLuxembourgMacao SAR, ChinaMacedonia, FYRMadagascarMalawiMalaysiaMaliMaltaMarshall IslandsMauritaniaMauritiusMexicoMicronesia, Fed. Sts.Middle East & North AfricaMiddle East & North Africa (excluding high income)Middle East & North Africa (IDA & IBRD countries)Middle incomeMoldovaMongoliaMontenegroMoroccoMozambiqueNamibiaNauruNetherlandsNew CaledoniaNew ZealandNicaraguaNigerNigeriaNorth AmericaNorthern Mariana IslandsNorwayOECD membersOmanOther small statesPacific island small statesPakistanPalauPanamaPapua New GuineaParaguayPeruPhilippinesPolandPortugalPost-demographic dividendPre-demographic dividendQatarRomaniaRussian FederationRwandaSamoaSao Tome and PrincipeSaudi ArabiaSenegalSerbiaSeychellesSierra LeoneSingaporeSint Maarten (Dutch part)Slovak RepublicSloveniaSmall statesSolomon IslandsSouth AfricaSouth AsiaSouth Asia (IDA & IBRD)SpainSri LankaSt. Kitts and NevisSt. LuciaSt. Vincent and the GrenadinesSub-Saharan Africa Sub-Saharan Africa (excluding high income)Sub-Saharan Africa (IDA & IBRD countries)SurinameSwazilandSwedenSwitzerlandSyrian Arab RepublicTajikistanTanzaniaThailandTimor-LesteTogoTongaTrinidad and TobagoTunisiaTurkeyUgandaUkraineUnited Arab EmiratesUnited KingdomUnited StatesUpper middle incomeUruguayVanuatuVenezuela, RBVietnamWest Bank and GazaWorldYemen, Rep.ZambiaZimbabwe Timeline:
This timeline shows a graph from 1977 to 2016 of Europe & Central Asia (IDA & IBRD countries). No data until 1976. Number of actual observations by date: 40.
Source name:
World Development Indicators
Source organization:
International Monetary Fund, Balance of Payments database, supplemented by data from the United Nations Conference on Trade and Development and official national sources.
Categories, topics:
Economy & Growth, Financial Sector
Last updated:
apr 23, 2017
Indicators value changes by year
Minimum:
1000.0K
jan 1, 1984
Maximum:
91.63 bln
jan 1, 2014
At the date of observation
Value
Absolute change
Change from previous value
jan 1, 1977
12.0 mln
+12.0 mln
0.0%
jan 1, 1978
17.0 mln
+5.0 mln
41.67%
jan 1, 1979
16.0 mln
-1000.0K
-5.88%
jan 1, 1980
13.0 mln
-3.0 mln
-18.75%
jan 1, 1981
21.0 mln
+8.0 mln
61.54%
jan 1, 1982
3.0 mln
-18.0 mln
-85.71%
jan 1, 1983
4.0 mln
+1000.0K
33.33%
jan 1, 1984
1000.0K
-3.0 mln
-75.0%
jan 1, 1985
12.01 mln
+11.01 mln
1.1K%
jan 1, 1986
1.01 mln
-11.0 mln
-91.59%
jan 1, 1987
22.01 mln
+21.0 mln
2.08K%
jan 1, 1988
23.12 mln
+1.11 mln
5.04%
jan 1, 1989
37.384 mln
+14.264 mln
61.7%
jan 1, 1990
20.214 mln
-17.17 mln
-45.93%
jan 1, 1991
35.851 mln
+15.637 mln
77.36%
jan 1, 1992
16.93 mln
-18.921 mln
-52.78%
jan 1, 1993
1.645 bln
+1.628 bln
9.62K%
jan 1, 1994
1.122 bln
-523.176 mln
-31.8%
jan 1, 1995
380.171 mln
-741.939 mln
-66.12%
jan 1, 1996
772.392 mln
+392.221 mln
103.17%
jan 1, 1997
1.083 bln
+311.087 mln
40.28%
jan 1, 1998
3.767 bln
+2.683 bln
247.66%
jan 1, 1999
2.164 bln
-1.603 bln
-42.54%
jan 1, 2000
3.138 bln
+973.49 mln
44.98%
jan 1, 2001
4.198 bln
+1.06 bln
33.78%
jan 1, 2002
3.629 bln
-568.912 mln
-13.55%
jan 1, 2003
5.658 bln
+2.029 bln
55.93%
jan 1, 2004
13.437 bln
+7.778 bln
137.47%
jan 1, 2005
20.129 bln
+6.692 bln
49.81%
jan 1, 2006
28.439 bln
+8.31 bln
41.28%
jan 1, 2007
49.447 bln
+21.009 bln
73.87%
jan 1, 2008
72.477 bln
+23.029 bln
46.57%
jan 1, 2009
75.798 bln
+3.321 bln
4.58%
jan 1, 2010
60.184 bln
-15.614 bln
-20.6%
jan 1, 2011
72.809 bln
+12.625 bln
20.98%
jan 1, 2012
84.496 bln
+11.687 bln
16.05%
jan 1, 2013
62.748 bln
-21.748 bln
-25.74%
jan 1, 2014
91.63 bln
+28.882 bln
46.03%
jan 1, 2015
80.102 bln
-11.528 bln
-12.58%
jan 1, 2016
40.212 bln
-39.889 bln
-49.8%
Ranking of countries by current statistics by years


Comments: