29
/
en
AIzaSyAYiBZKx7MnpbEhh9jyipgxe19OcubqV5w
April 1, 2024
280958
Venezuela, RB
VEN
true
2
1
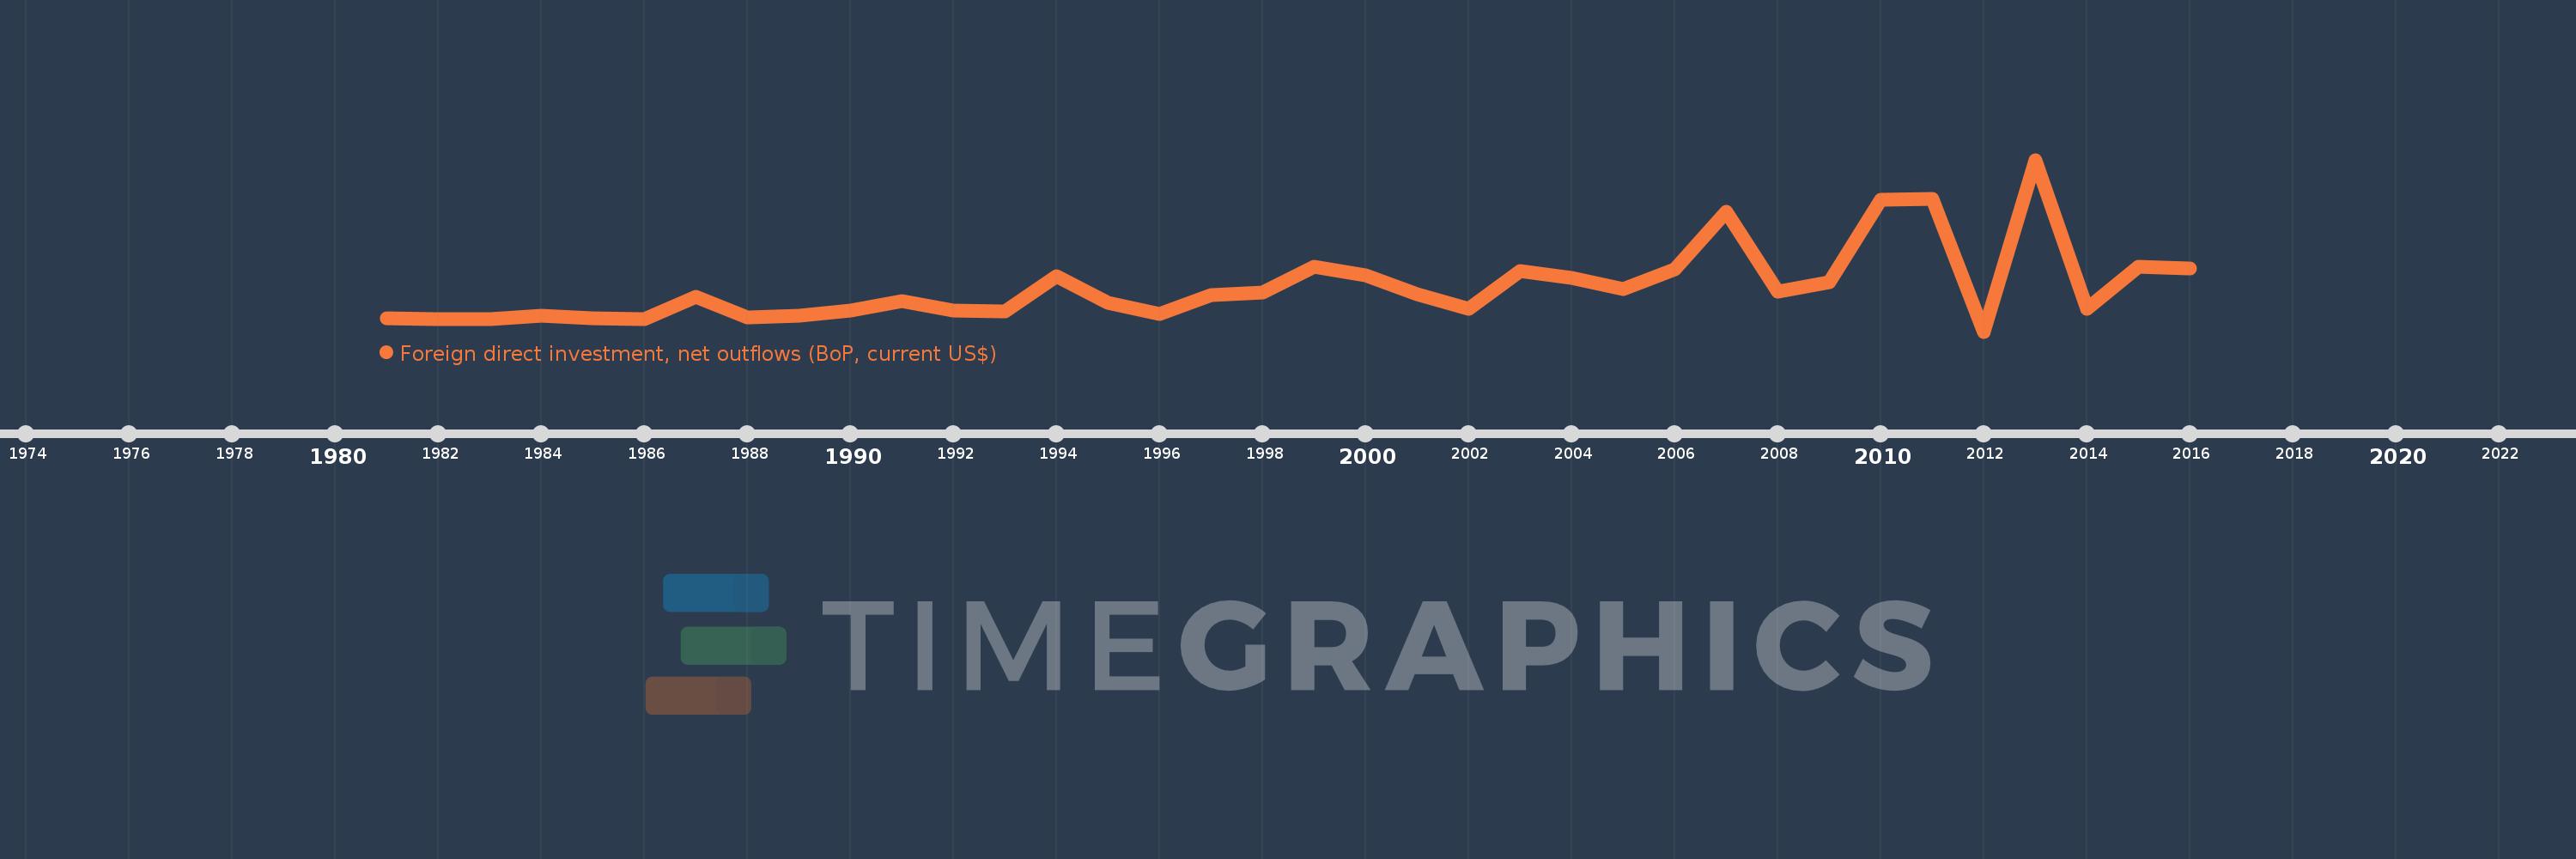
Foreign direct investment, net outflows (BoP, current US$)
2016,2015,2014,2013,2012,2011,2010,2009,2008,2007,2006,2005,2004,2003,2002,2001,2000,1999,1998,1997,1996,1995,1994,1993,1992,1991,1990,1989,1988,1987,1986,1985,1984,1983,1982,1981
This statistics in other country:
AfghanistanAlbaniaAlgeriaAngolaAntigua and BarbudaArab WorldArgentinaArmeniaArubaAustraliaAustriaAzerbaijanBahamas, TheBahrainBangladeshBarbadosBelarusBelgiumBelizeBeninBermudaBoliviaBosnia and HerzegovinaBotswanaBrazilBritish Virgin IslandsBrunei DarussalamBulgariaBurkina FasoBurundiCabo VerdeCambodiaCameroonCanadaCaribbean small statesCayman IslandsCentral African RepublicCentral Europe and the BalticsChadChileChinaColombiaComorosCongo, Dem. Rep.Congo, Rep.Costa RicaCote d'IvoireCroatiaCuracaoCyprusCzech RepublicDenmarkDominicaDominican RepublicEarly-demographic dividendEast Asia & PacificEast Asia & Pacific (excluding high income)East Asia & Pacific (IDA & IBRD countries)EcuadorEgypt, Arab Rep.El SalvadorEquatorial GuineaEritreaEstoniaEuro areaEurope & Central AsiaEurope & Central Asia (excluding high income)Europe & Central Asia (IDA & IBRD countries)European UnionFijiFinlandFragile and conflict affected situationsFranceFrench PolynesiaGabonGambia, TheGeorgiaGermanyGhanaGreeceGrenadaGuatemalaGuineaGuinea-BissauGuyanaHaitiHeavily indebted poor countries (HIPC)High incomeHondurasHong Kong SAR, ChinaHungaryIBRD onlyIcelandIDA & IBRD totalIDA blendIDA onlyIDA totalIndiaIndonesiaIran, Islamic Rep.IraqIrelandIsraelItalyJamaicaJapanJordanKazakhstanKenyaKiribatiKorea, Dem. People’s Rep.Korea, Rep.KosovoKuwaitKyrgyz RepublicLao PDRLate-demographic dividendLatin America & Caribbean Latin America & Caribbean (excluding high income)Latin America & the Caribbean (IDA & IBRD countries)LatviaLeast developed countries: UN classificationLebanonLesothoLiberiaLibyaLithuaniaLow & middle incomeLow incomeLower middle incomeLuxembourgMacao SAR, ChinaMacedonia, FYRMadagascarMalawiMalaysiaMaliMaltaMarshall IslandsMauritaniaMauritiusMexicoMicronesia, Fed. Sts.Middle East & North AfricaMiddle East & North Africa (excluding high income)Middle East & North Africa (IDA & IBRD countries)Middle incomeMoldovaMongoliaMontenegroMoroccoMozambiqueNamibiaNauruNetherlandsNew CaledoniaNew ZealandNicaraguaNigerNigeriaNorth AmericaNorthern Mariana IslandsNorwayOECD membersOmanOther small statesPacific island small statesPakistanPalauPanamaPapua New GuineaParaguayPeruPhilippinesPolandPortugalPost-demographic dividendPre-demographic dividendQatarRomaniaRussian FederationRwandaSamoaSao Tome and PrincipeSaudi ArabiaSenegalSerbiaSeychellesSierra LeoneSingaporeSint Maarten (Dutch part)Slovak RepublicSloveniaSmall statesSolomon IslandsSouth AfricaSouth AsiaSouth Asia (IDA & IBRD)SpainSri LankaSt. Kitts and NevisSt. LuciaSt. Vincent and the GrenadinesSub-Saharan Africa Sub-Saharan Africa (excluding high income)Sub-Saharan Africa (IDA & IBRD countries)SurinameSwazilandSwedenSwitzerlandSyrian Arab RepublicTajikistanTanzaniaThailandTimor-LesteTogoTongaTrinidad and TobagoTunisiaTurkeyUgandaUkraineUnited Arab EmiratesUnited KingdomUnited StatesUpper middle incomeUruguayVanuatuVenezuela, RBVietnamWest Bank and GazaWorldYemen, Rep.ZambiaZimbabwe Timeline:
This timeline shows a graph from 1981 to 2016 of Venezuela, RB. No data until 1980. Number of actual observations by date: 36.
Source name:
World Development Indicators
Source organization:
International Monetary Fund, Balance of Payments database, supplemented by data from the United Nations Conference on Trade and Development and official national sources.
Categories, topics:
Economy & Growth, Financial Sector
Last updated:
apr 23, 2017
Indicators value changes by year
Minimum:
-255.0 mln
jan 1, 2012
Maximum:
3.307 bln
jan 1, 2013
At the date of observation
Value
Absolute change
Change from previous value
jan 1, 1981
12.497 mln
+12.497 mln
0.0%
jan 1, 1982
6.534 mln
-5.963 mln
-47.72%
jan 1, 1983
4.0 mln
-2.534 mln
-38.78%
jan 1, 1984
67.0 mln
+63.0 mln
1.57K%
jan 1, 1985
21.0 mln
-46.0 mln
-68.66%
jan 1, 1986
11.0 mln
-10.0 mln
-47.62%
jan 1, 1987
460.0 mln
+449.0 mln
4.08K%
jan 1, 1988
37.0 mln
-423.0 mln
-91.96%
jan 1, 1989
68.0 mln
+31.0 mln
83.78%
jan 1, 1990
179.0 mln
+111.0 mln
163.24%
jan 1, 1991
375.0 mln
+196.0 mln
109.5%
jan 1, 1992
188.0 mln
-187.0 mln
-49.87%
jan 1, 1993
156.0 mln
-32.0 mln
-17.02%
jan 1, 1994
886.0 mln
+730.0 mln
467.95%
jan 1, 1995
346.0 mln
-540.0 mln
-60.95%
jan 1, 1996
102.0 mln
-244.0 mln
-70.52%
jan 1, 1997
507.0 mln
+405.0 mln
397.06%
jan 1, 1998
557.0 mln
+50.0 mln
9.86%
jan 1, 1999
1.082 bln
+525.0 mln
94.25%
jan 1, 2000
914.0 mln
-168.0 mln
-15.53%
jan 1, 2001
523.0 mln
-391.0 mln
-42.78%
jan 1, 2002
225.0 mln
-298.0 mln
-56.98%
jan 1, 2003
1.005 bln
+780.0 mln
346.67%
jan 1, 2004
851.0 mln
-154.0 mln
-15.32%
jan 1, 2005
625.0 mln
-226.0 mln
-26.56%
jan 1, 2006
1.028 bln
+403.0 mln
64.48%
jan 1, 2007
2.23 bln
+1.202 bln
116.93%
jan 1, 2008
575.0 mln
-1.655 bln
-74.22%
jan 1, 2009
767.0 mln
+192.0 mln
33.39%
jan 1, 2010
2.476 bln
+1.709 bln
222.82%
jan 1, 2011
2.501 bln
+25.0 mln
1.01%
jan 1, 2012
-255.0 mln
-2.756 bln
-110.2%
jan 1, 2013
3.307 bln
+3.562 bln
-1.4K%
jan 1, 2014
217.0 mln
-3.09 bln
-93.44%
jan 1, 2015
1.094 bln
+877.0 mln
404.15%
jan 1, 2016
1.054 bln
-40.0 mln
-3.66%
Ranking of countries by current statistics by years


Comments: