29
/
en
AIzaSyAYiBZKx7MnpbEhh9jyipgxe19OcubqV5w
April 1, 2024
118894
Denmark
DNK
true
2
1
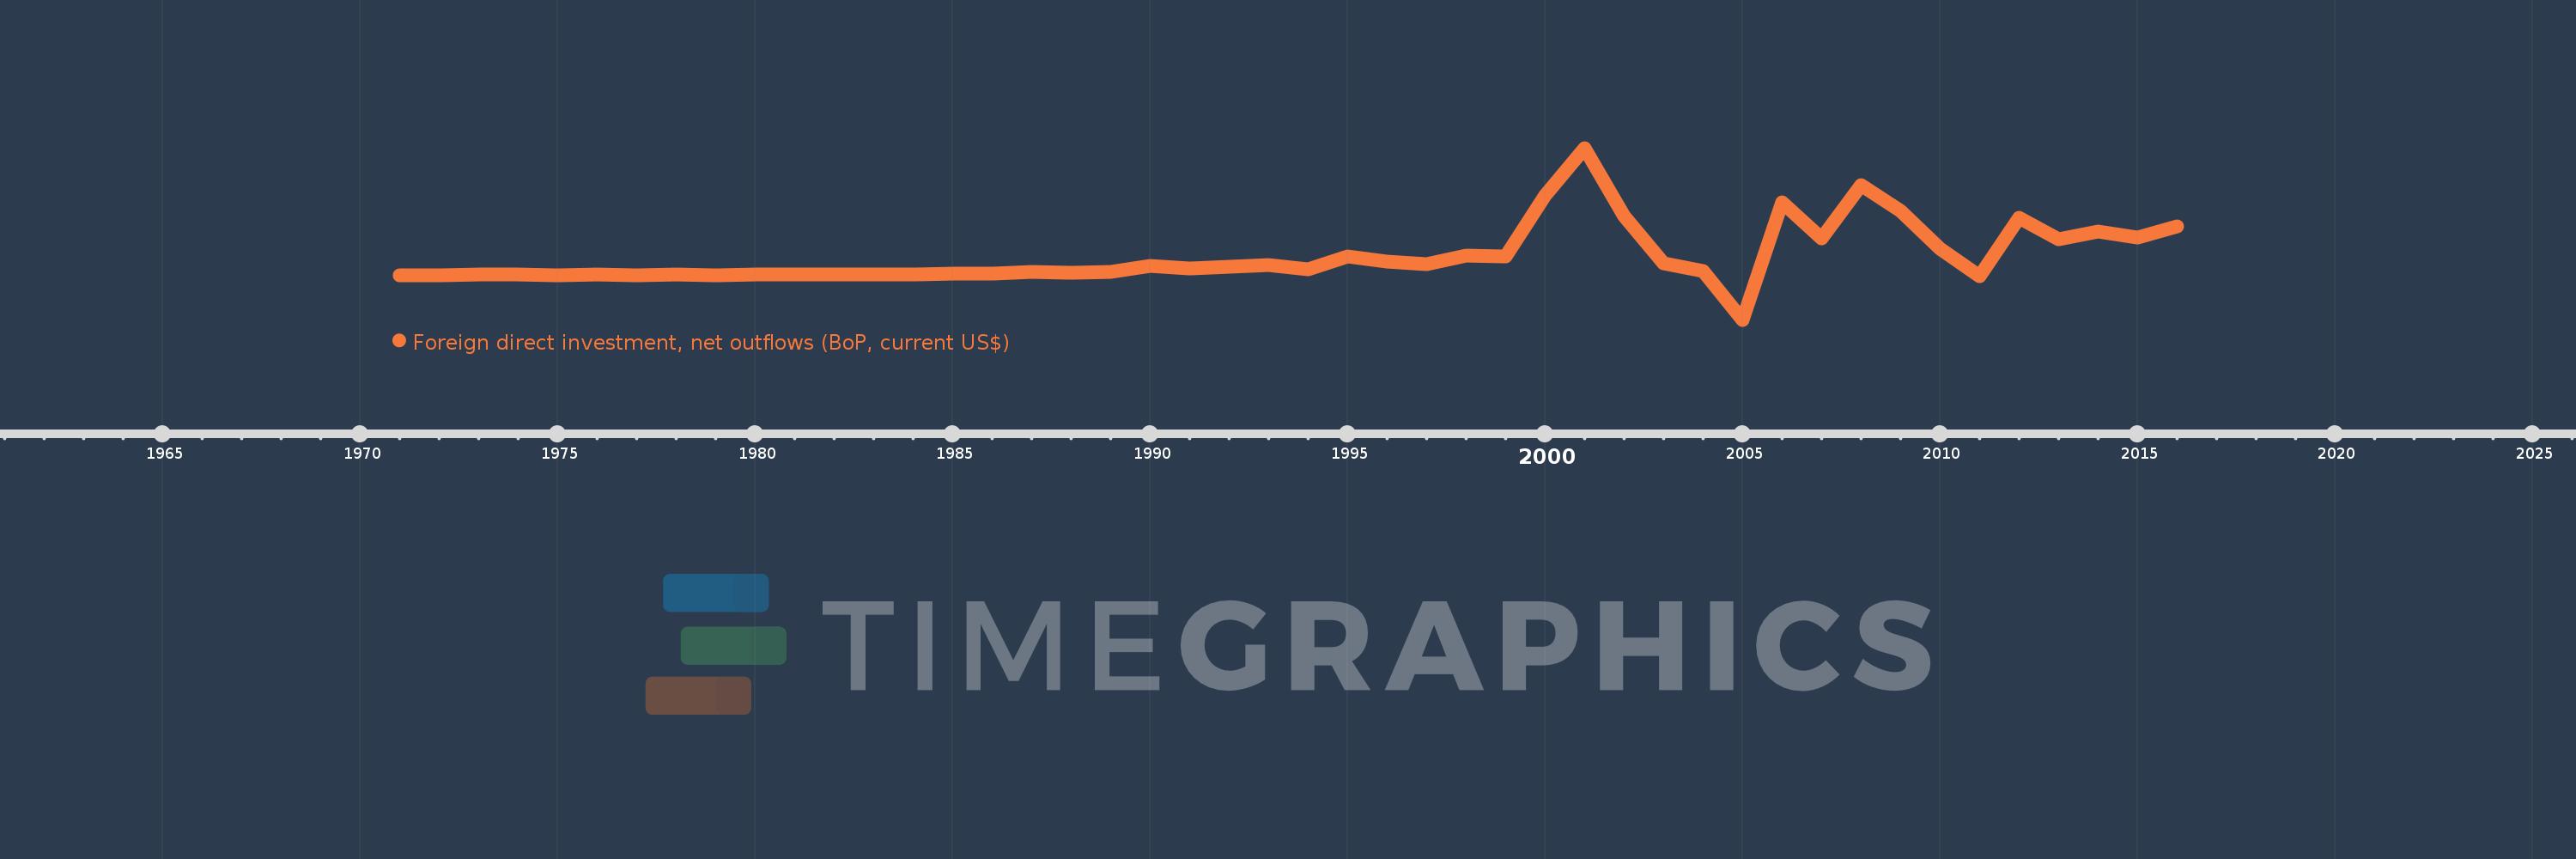
Foreign direct investment, net outflows (BoP, current US$)
2016,2015,2014,2013,2012,2011,2010,2009,2008,2007,2006,2005,2004,2003,2002,2001,2000,1999,1998,1997,1996,1995,1994,1993,1992,1991,1990,1989,1988,1987,1986,1985,1984,1983,1982,1981,1980,1979,1978,1977,1976,1975,1974,1973,1972,1971
This statistics in other country:
AfghanistanAlbaniaAlgeriaAngolaAntigua and BarbudaArab WorldArgentinaArmeniaArubaAustraliaAustriaAzerbaijanBahamas, TheBahrainBangladeshBarbadosBelarusBelgiumBelizeBeninBermudaBoliviaBosnia and HerzegovinaBotswanaBrazilBritish Virgin IslandsBrunei DarussalamBulgariaBurkina FasoBurundiCabo VerdeCambodiaCameroonCanadaCaribbean small statesCayman IslandsCentral African RepublicCentral Europe and the BalticsChadChileChinaColombiaComorosCongo, Dem. Rep.Congo, Rep.Costa RicaCote d'IvoireCroatiaCuracaoCyprusCzech RepublicDenmarkDominicaDominican RepublicEarly-demographic dividendEast Asia & PacificEast Asia & Pacific (excluding high income)East Asia & Pacific (IDA & IBRD countries)EcuadorEgypt, Arab Rep.El SalvadorEquatorial GuineaEritreaEstoniaEuro areaEurope & Central AsiaEurope & Central Asia (excluding high income)Europe & Central Asia (IDA & IBRD countries)European UnionFijiFinlandFragile and conflict affected situationsFranceFrench PolynesiaGabonGambia, TheGeorgiaGermanyGhanaGreeceGrenadaGuatemalaGuineaGuinea-BissauGuyanaHaitiHeavily indebted poor countries (HIPC)High incomeHondurasHong Kong SAR, ChinaHungaryIBRD onlyIcelandIDA & IBRD totalIDA blendIDA onlyIDA totalIndiaIndonesiaIran, Islamic Rep.IraqIrelandIsraelItalyJamaicaJapanJordanKazakhstanKenyaKiribatiKorea, Dem. People’s Rep.Korea, Rep.KosovoKuwaitKyrgyz RepublicLao PDRLate-demographic dividendLatin America & Caribbean Latin America & Caribbean (excluding high income)Latin America & the Caribbean (IDA & IBRD countries)LatviaLeast developed countries: UN classificationLebanonLesothoLiberiaLibyaLithuaniaLow & middle incomeLow incomeLower middle incomeLuxembourgMacao SAR, ChinaMacedonia, FYRMadagascarMalawiMalaysiaMaliMaltaMarshall IslandsMauritaniaMauritiusMexicoMicronesia, Fed. Sts.Middle East & North AfricaMiddle East & North Africa (excluding high income)Middle East & North Africa (IDA & IBRD countries)Middle incomeMoldovaMongoliaMontenegroMoroccoMozambiqueNamibiaNauruNetherlandsNew CaledoniaNew ZealandNicaraguaNigerNigeriaNorth AmericaNorthern Mariana IslandsNorwayOECD membersOmanOther small statesPacific island small statesPakistanPalauPanamaPapua New GuineaParaguayPeruPhilippinesPolandPortugalPost-demographic dividendPre-demographic dividendQatarRomaniaRussian FederationRwandaSamoaSao Tome and PrincipeSaudi ArabiaSenegalSerbiaSeychellesSierra LeoneSingaporeSint Maarten (Dutch part)Slovak RepublicSloveniaSmall statesSolomon IslandsSouth AfricaSouth AsiaSouth Asia (IDA & IBRD)SpainSri LankaSt. Kitts and NevisSt. LuciaSt. Vincent and the GrenadinesSub-Saharan Africa Sub-Saharan Africa (excluding high income)Sub-Saharan Africa (IDA & IBRD countries)SurinameSwazilandSwedenSwitzerlandSyrian Arab RepublicTajikistanTanzaniaThailandTimor-LesteTogoTongaTrinidad and TobagoTunisiaTurkeyUgandaUkraineUnited Arab EmiratesUnited KingdomUnited StatesUpper middle incomeUruguayVanuatuVenezuela, RBVietnamWest Bank and GazaWorldYemen, Rep.ZambiaZimbabwe Timeline:
This timeline shows a graph from 1971 to 2016 of Denmark. No data until 1970. Number of actual observations by date: 46.
Source name:
World Development Indicators
Source organization:
International Monetary Fund, Balance of Payments database, supplemented by data from the United Nations Conference on Trade and Development and official national sources.
Categories, topics:
Economy & Growth, Financial Sector
Last updated:
apr 23, 2017
Indicators value changes by year
Minimum:
-9.93 bln
jan 1, 2005
Maximum:
28.381 bln
jan 1, 2001
At the date of observation
Value
Absolute change
Change from previous value
jan 1, 1971
29.0 mln
+29.0 mln
0.0%
jan 1, 1972
52.0 mln
+23.0 mln
79.31%
jan 1, 1973
148.0 mln
+96.0 mln
184.62%
jan 1, 1974
98.0 mln
-50.0 mln
-33.78%
jan 1, 1975
8.0 mln
-90.0 mln
-91.84%
jan 1, 1976
78.812 mln
+70.812 mln
885.15%
jan 1, 1977
63.541 mln
-15.271 mln
-19.38%
jan 1, 1978
161.269 mln
+97.728 mln
153.8%
jan 1, 1979
33.22 mln
-128.048 mln
-79.4%
jan 1, 1980
167.363 mln
+134.143 mln
403.8%
jan 1, 1981
195.651 mln
+28.288 mln
16.9%
jan 1, 1982
138.792 mln
-56.859 mln
-29.06%
jan 1, 1983
81.721 mln
-57.071 mln
-41.12%
jan 1, 1984
150.12 mln
+68.399 mln
83.7%
jan 1, 1985
288.864 mln
+138.744 mln
92.42%
jan 1, 1986
306.436 mln
+17.572 mln
6.08%
jan 1, 1987
654.454 mln
+348.018 mln
113.57%
jan 1, 1988
618.62 mln
-35.834 mln
-5.48%
jan 1, 1989
720.487 mln
+101.867 mln
16.47%
jan 1, 1990
2.066 bln
+1.345 bln
186.72%
jan 1, 1991
1.482 bln
-583.566 mln
-28.25%
jan 1, 1992
1.852 bln
+369.754 mln
24.95%
jan 1, 1993
2.236 bln
+384.064 mln
20.74%
jan 1, 1994
1.373 bln
-863.056 mln
-38.6%
jan 1, 1995
4.162 bln
+2.789 bln
203.12%
jan 1, 1996
2.969 bln
-1.193 bln
-28.67%
jan 1, 1997
2.51 bln
-458.207 mln
-15.43%
jan 1, 1998
4.355 bln
+1.844 bln
73.47%
jan 1, 1999
4.215 bln
-140.202 mln
-3.22%
jan 1, 2000
17.819 bln
+13.604 bln
322.79%
jan 1, 2001
28.381 bln
+10.562 bln
59.27%
jan 1, 2002
13.154 bln
-15.228 bln
-53.65%
jan 1, 2003
2.65 bln
-10.504 bln
-79.86%
jan 1, 2004
856.293 mln
-1.793 bln
-67.68%
jan 1, 2005
-9.93 bln
-10.786 bln
-1.26K%
jan 1, 2006
16.206 bln
+26.136 bln
-263.21%
jan 1, 2007
8.146 bln
-8.06 bln
-49.74%
jan 1, 2008
19.995 bln
+11.849 bln
145.46%
jan 1, 2009
14.324 bln
-5.671 bln
-28.36%
jan 1, 2010
5.861 bln
-8.463 bln
-59.08%
jan 1, 2011
-266.068 mln
-6.127 bln
-104.54%
jan 1, 2012
12.795 bln
+13.061 bln
-4.91K%
jan 1, 2013
7.964 bln
-4.831 bln
-37.76%
jan 1, 2014
9.763 bln
+1.799 bln
22.59%
jan 1, 2015
8.402 bln
-1.361 bln
-13.94%
jan 1, 2016
10.893 bln
+2.491 bln
29.65%
Ranking of countries by current statistics by years


Comments: