29
/
en
AIzaSyAYiBZKx7MnpbEhh9jyipgxe19OcubqV5w
April 1, 2024
54768
Post-demographic dividend
PST
false
2
1
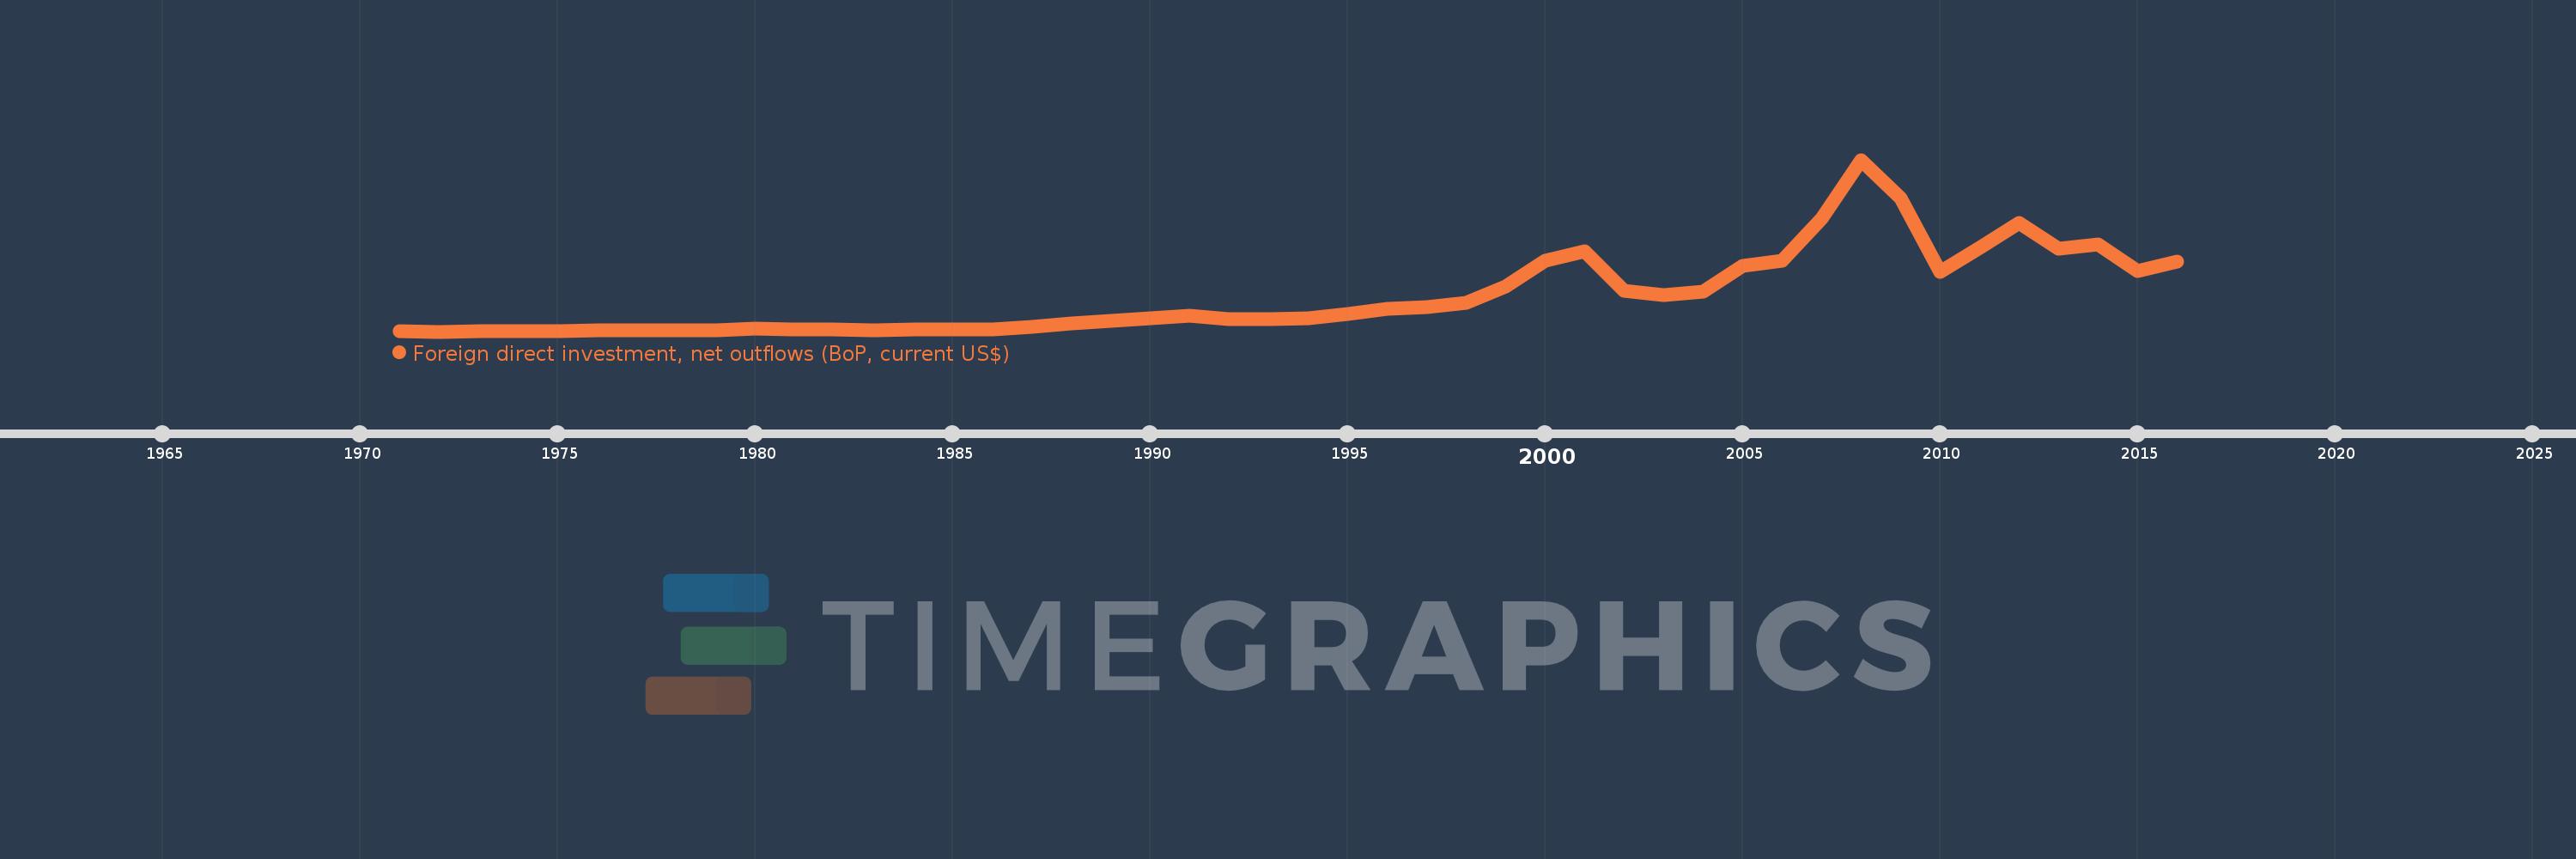
Foreign direct investment, net outflows (BoP, current US$)
2016,2015,2014,2013,2012,2011,2010,2009,2008,2007,2006,2005,2004,2003,2002,2001,2000,1999,1998,1997,1996,1995,1994,1993,1992,1991,1990,1989,1988,1987,1986,1985,1984,1983,1982,1981,1980,1979,1978,1977,1976,1975,1974,1973,1972,1971
This statistics in other country:
AfghanistanAlbaniaAlgeriaAngolaAntigua and BarbudaArab WorldArgentinaArmeniaArubaAustraliaAustriaAzerbaijanBahamas, TheBahrainBangladeshBarbadosBelarusBelgiumBelizeBeninBermudaBoliviaBosnia and HerzegovinaBotswanaBrazilBritish Virgin IslandsBrunei DarussalamBulgariaBurkina FasoBurundiCabo VerdeCambodiaCameroonCanadaCaribbean small statesCayman IslandsCentral African RepublicCentral Europe and the BalticsChadChileChinaColombiaComorosCongo, Dem. Rep.Congo, Rep.Costa RicaCote d'IvoireCroatiaCuracaoCyprusCzech RepublicDenmarkDominicaDominican RepublicEarly-demographic dividendEast Asia & PacificEast Asia & Pacific (excluding high income)East Asia & Pacific (IDA & IBRD countries)EcuadorEgypt, Arab Rep.El SalvadorEquatorial GuineaEritreaEstoniaEuro areaEurope & Central AsiaEurope & Central Asia (excluding high income)Europe & Central Asia (IDA & IBRD countries)European UnionFijiFinlandFragile and conflict affected situationsFranceFrench PolynesiaGabonGambia, TheGeorgiaGermanyGhanaGreeceGrenadaGuatemalaGuineaGuinea-BissauGuyanaHaitiHeavily indebted poor countries (HIPC)High incomeHondurasHong Kong SAR, ChinaHungaryIBRD onlyIcelandIDA & IBRD totalIDA blendIDA onlyIDA totalIndiaIndonesiaIran, Islamic Rep.IraqIrelandIsraelItalyJamaicaJapanJordanKazakhstanKenyaKiribatiKorea, Dem. People’s Rep.Korea, Rep.KosovoKuwaitKyrgyz RepublicLao PDRLate-demographic dividendLatin America & Caribbean Latin America & Caribbean (excluding high income)Latin America & the Caribbean (IDA & IBRD countries)LatviaLeast developed countries: UN classificationLebanonLesothoLiberiaLibyaLithuaniaLow & middle incomeLow incomeLower middle incomeLuxembourgMacao SAR, ChinaMacedonia, FYRMadagascarMalawiMalaysiaMaliMaltaMarshall IslandsMauritaniaMauritiusMexicoMicronesia, Fed. Sts.Middle East & North AfricaMiddle East & North Africa (excluding high income)Middle East & North Africa (IDA & IBRD countries)Middle incomeMoldovaMongoliaMontenegroMoroccoMozambiqueNamibiaNauruNetherlandsNew CaledoniaNew ZealandNicaraguaNigerNigeriaNorth AmericaNorthern Mariana IslandsNorwayOECD membersOmanOther small statesPacific island small statesPakistanPalauPanamaPapua New GuineaParaguayPeruPhilippinesPolandPortugalPost-demographic dividendPre-demographic dividendQatarRomaniaRussian FederationRwandaSamoaSao Tome and PrincipeSaudi ArabiaSenegalSerbiaSeychellesSierra LeoneSingaporeSint Maarten (Dutch part)Slovak RepublicSloveniaSmall statesSolomon IslandsSouth AfricaSouth AsiaSouth Asia (IDA & IBRD)SpainSri LankaSt. Kitts and NevisSt. LuciaSt. Vincent and the GrenadinesSub-Saharan Africa Sub-Saharan Africa (excluding high income)Sub-Saharan Africa (IDA & IBRD countries)SurinameSwazilandSwedenSwitzerlandSyrian Arab RepublicTajikistanTanzaniaThailandTimor-LesteTogoTongaTrinidad and TobagoTunisiaTurkeyUgandaUkraineUnited Arab EmiratesUnited KingdomUnited StatesUpper middle incomeUruguayVanuatuVenezuela, RBVietnamWest Bank and GazaWorldYemen, Rep.ZambiaZimbabwe Timeline:
This timeline shows a graph from 1971 to 2016 of Post-demographic dividend. No data until 1970. Number of actual observations by date: 46.
Source name:
World Development Indicators
Source organization:
International Monetary Fund, Balance of Payments database, supplemented by data from the United Nations Conference on Trade and Development and official national sources.
Categories, topics:
Economy & Growth, Financial Sector
Last updated:
apr 23, 2017
Indicators value changes by year
Minimum:
12.392 bln
jan 1, 1972
Maximum:
2.819 trl
jan 1, 2008
At the date of observation
Value
Absolute change
Change from previous value
jan 1, 1971
12.99 bln
+12.99 bln
0.0%
jan 1, 1972
12.392 bln
-597.869 mln
-4.6%
jan 1, 1973
15.258 bln
+2.866 bln
23.13%
jan 1, 1974
23.848 bln
+8.589 bln
56.29%
jan 1, 1975
20.341 bln
-3.507 bln
-14.7%
jan 1, 1976
27.502 bln
+7.161 bln
35.21%
jan 1, 1977
27.255 bln
-247.091 mln
-0.9%
jan 1, 1978
27.908 bln
+652.511 mln
2.39%
jan 1, 1979
36.987 bln
+9.079 bln
32.53%
jan 1, 1980
60.898 bln
+23.911 bln
64.65%
jan 1, 1981
53.247 bln
-7.652 bln
-12.56%
jan 1, 1982
49.732 bln
-3.514 bln
-6.6%
jan 1, 1983
35.232 bln
-14.5 bln
-29.16%
jan 1, 1984
41.438 bln
+6.206 bln
17.62%
jan 1, 1985
52.254 bln
+10.816 bln
26.1%
jan 1, 1986
49.48 bln
-2.774 bln
-5.31%
jan 1, 1987
92.881 bln
+43.401 bln
87.71%
jan 1, 1988
145.922 bln
+53.041 bln
57.11%
jan 1, 1989
181.115 bln
+35.193 bln
24.12%
jan 1, 1990
227.138 bln
+46.023 bln
25.41%
jan 1, 1991
270.969 bln
+43.831 bln
19.3%
jan 1, 1992
212.531 bln
-58.438 bln
-21.57%
jan 1, 1993
214.284 bln
+1.753 bln
0.82%
jan 1, 1994
233.926 bln
+19.642 bln
9.17%
jan 1, 1995
295.624 bln
+61.698 bln
26.38%
jan 1, 1996
379.143 bln
+83.519 bln
28.25%
jan 1, 1997
412.017 bln
+32.874 bln
8.67%
jan 1, 1998
486.545 bln
+74.528 bln
18.09%
jan 1, 1999
747.468 bln
+260.922 bln
53.63%
jan 1, 2000
1.166 trl
+418.176 bln
55.95%
jan 1, 2001
1.328 trl
+162.855 bln
13.97%
jan 1, 2002
682.419 bln
-646.08 bln
-48.63%
jan 1, 2003
614.231 bln
-68.187 bln
-9.99%
jan 1, 2004
666.977 bln
+52.746 bln
8.59%
jan 1, 2005
1.091 trl
+423.819 bln
63.54%
jan 1, 2006
1.175 trl
+84.161 bln
7.72%
jan 1, 2007
1.862 trl
+687.141 bln
58.48%
jan 1, 2008
2.819 trl
+957.352 bln
51.41%
jan 1, 2009
2.197 trl
-622.341 bln
-22.07%
jan 1, 2010
989.423 bln
-1.208 trl
-54.97%
jan 1, 2011
1.377 trl
+387.669 bln
39.18%
jan 1, 2012
1.783 trl
+405.825 bln
29.47%
jan 1, 2013
1.373 trl
-410.023 bln
-23.0%
jan 1, 2014
1.439 trl
+66.067 bln
4.81%
jan 1, 2015
994.962 bln
-443.998 bln
-30.86%
jan 1, 2016
1.156 trl
+161.288 bln
16.21%
Ranking of countries by current statistics by years


Comments: