29
/
en
AIzaSyAYiBZKx7MnpbEhh9jyipgxe19OcubqV5w
April 1, 2024
245572
South Africa
ZAF
true
2
1
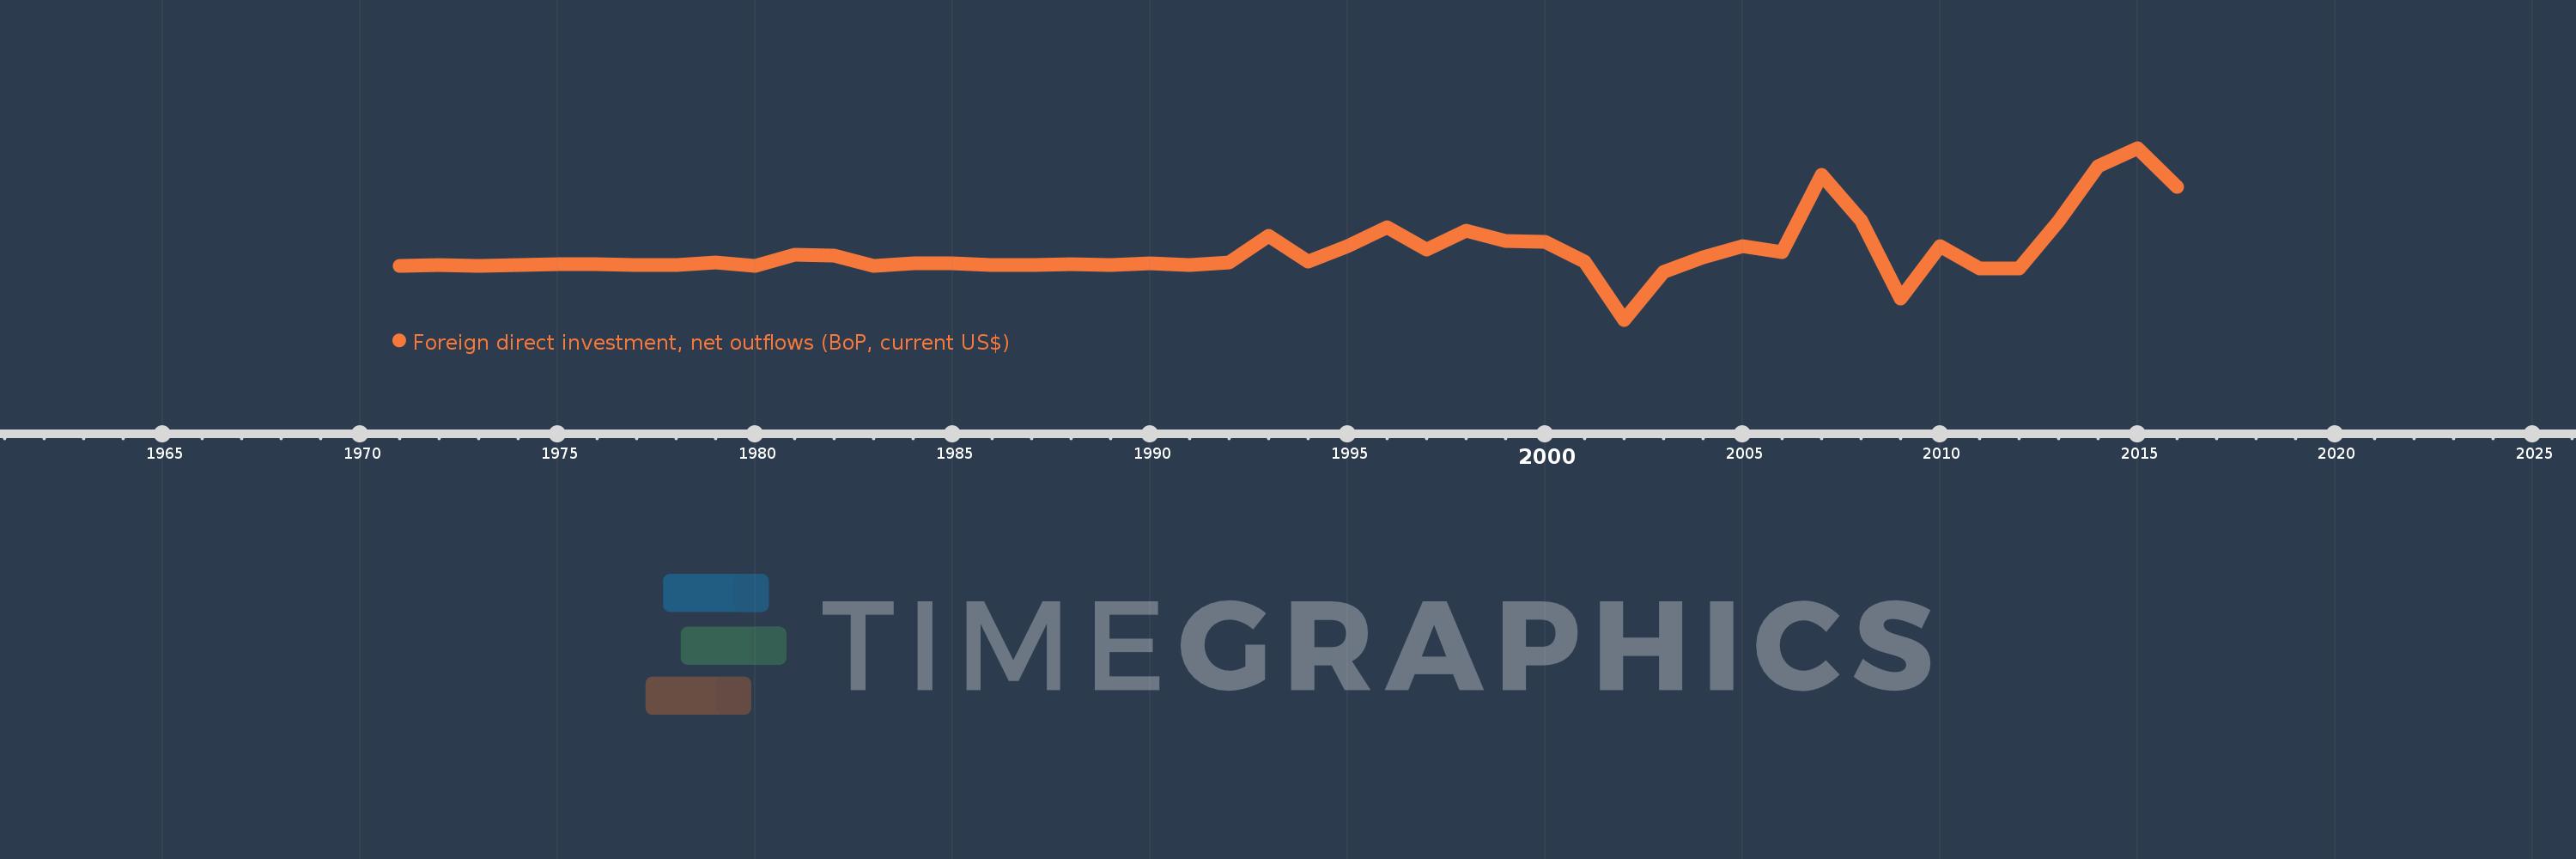
Foreign direct investment, net outflows (BoP, current US$)
2016,2015,2014,2013,2012,2011,2010,2009,2008,2007,2006,2005,2004,2003,2002,2001,2000,1999,1998,1997,1996,1995,1994,1993,1992,1991,1990,1989,1988,1987,1986,1985,1984,1983,1982,1981,1980,1979,1978,1977,1976,1975,1974,1973,1972,1971
This statistics in other country:
AfghanistanAlbaniaAlgeriaAngolaAntigua and BarbudaArab WorldArgentinaArmeniaArubaAustraliaAustriaAzerbaijanBahamas, TheBahrainBangladeshBarbadosBelarusBelgiumBelizeBeninBermudaBoliviaBosnia and HerzegovinaBotswanaBrazilBritish Virgin IslandsBrunei DarussalamBulgariaBurkina FasoBurundiCabo VerdeCambodiaCameroonCanadaCaribbean small statesCayman IslandsCentral African RepublicCentral Europe and the BalticsChadChileChinaColombiaComorosCongo, Dem. Rep.Congo, Rep.Costa RicaCote d'IvoireCroatiaCuracaoCyprusCzech RepublicDenmarkDominicaDominican RepublicEarly-demographic dividendEast Asia & PacificEast Asia & Pacific (excluding high income)East Asia & Pacific (IDA & IBRD countries)EcuadorEgypt, Arab Rep.El SalvadorEquatorial GuineaEritreaEstoniaEuro areaEurope & Central AsiaEurope & Central Asia (excluding high income)Europe & Central Asia (IDA & IBRD countries)European UnionFijiFinlandFragile and conflict affected situationsFranceFrench PolynesiaGabonGambia, TheGeorgiaGermanyGhanaGreeceGrenadaGuatemalaGuineaGuinea-BissauGuyanaHaitiHeavily indebted poor countries (HIPC)High incomeHondurasHong Kong SAR, ChinaHungaryIBRD onlyIcelandIDA & IBRD totalIDA blendIDA onlyIDA totalIndiaIndonesiaIran, Islamic Rep.IraqIrelandIsraelItalyJamaicaJapanJordanKazakhstanKenyaKiribatiKorea, Dem. People’s Rep.Korea, Rep.KosovoKuwaitKyrgyz RepublicLao PDRLate-demographic dividendLatin America & Caribbean Latin America & Caribbean (excluding high income)Latin America & the Caribbean (IDA & IBRD countries)LatviaLeast developed countries: UN classificationLebanonLesothoLiberiaLibyaLithuaniaLow & middle incomeLow incomeLower middle incomeLuxembourgMacao SAR, ChinaMacedonia, FYRMadagascarMalawiMalaysiaMaliMaltaMarshall IslandsMauritaniaMauritiusMexicoMicronesia, Fed. Sts.Middle East & North AfricaMiddle East & North Africa (excluding high income)Middle East & North Africa (IDA & IBRD countries)Middle incomeMoldovaMongoliaMontenegroMoroccoMozambiqueNamibiaNauruNetherlandsNew CaledoniaNew ZealandNicaraguaNigerNigeriaNorth AmericaNorthern Mariana IslandsNorwayOECD membersOmanOther small statesPacific island small statesPakistanPalauPanamaPapua New GuineaParaguayPeruPhilippinesPolandPortugalPost-demographic dividendPre-demographic dividendQatarRomaniaRussian FederationRwandaSamoaSao Tome and PrincipeSaudi ArabiaSenegalSerbiaSeychellesSierra LeoneSingaporeSint Maarten (Dutch part)Slovak RepublicSloveniaSmall statesSolomon IslandsSouth AfricaSouth AsiaSouth Asia (IDA & IBRD)SpainSri LankaSt. Kitts and NevisSt. LuciaSt. Vincent and the GrenadinesSub-Saharan Africa Sub-Saharan Africa (excluding high income)Sub-Saharan Africa (IDA & IBRD countries)SurinameSwazilandSwedenSwitzerlandSyrian Arab RepublicTajikistanTanzaniaThailandTimor-LesteTogoTongaTrinidad and TobagoTunisiaTurkeyUgandaUkraineUnited Arab EmiratesUnited KingdomUnited StatesUpper middle incomeUruguayVanuatuVenezuela, RBVietnamWest Bank and GazaWorldYemen, Rep.ZambiaZimbabwe Timeline:
This timeline shows a graph from 1971 to 2016 of South Africa. No data until 1970. Number of actual observations by date: 46.
Source name:
World Development Indicators
Source organization:
International Monetary Fund, Balance of Payments database, supplemented by data from the United Nations Conference on Trade and Development and official national sources.
Categories, topics:
Economy & Growth, Financial Sector
Last updated:
apr 23, 2017
Indicators value changes by year
Minimum:
-3.515 bln
jan 1, 2002
Maximum:
7.692 bln
jan 1, 2015
At the date of observation
Value
Absolute change
Change from previous value
jan 1, 1971
16.8 mln
+16.8 mln
0.0%
jan 1, 1972
29.362 mln
+12.562 mln
74.77%
jan 1, 1973
19.513 mln
-9.848 mln
-33.54%
jan 1, 1974
51.876 mln
+32.363 mln
165.85%
jan 1, 1975
114.794 mln
+62.918 mln
121.28%
jan 1, 1976
125.759 mln
+10.965 mln
9.55%
jan 1, 1977
32.2 mln
-93.559 mln
-74.4%
jan 1, 1978
67.85 mln
+35.65 mln
110.71%
jan 1, 1979
238.05 mln
+170.2 mln
250.85%
jan 1, 1980
10.689 mln
-227.362 mln
-95.51%
jan 1, 1981
755.0 mln
+744.311 mln
6.96K%
jan 1, 1982
643.9 mln
-111.1 mln
-14.72%
jan 1, 1983
-5.5 mln
-649.4 mln
-100.85%
jan 1, 1984
156.2 mln
+161.7 mln
-2.94K%
jan 1, 1985
193.1 mln
+36.9 mln
23.62%
jan 1, 1986
47.357 mln
-145.743 mln
-75.48%
jan 1, 1987
70.98 mln
+23.624 mln
49.88%
jan 1, 1988
112.125 mln
+41.144 mln
57.97%
jan 1, 1989
64.566 mln
-47.559 mln
-42.42%
jan 1, 1990
162.7 mln
+98.133 mln
151.99%
jan 1, 1991
27.974 mln
-134.725 mln
-82.81%
jan 1, 1992
206.438 mln
+178.464 mln
637.96%
jan 1, 1993
1.939 bln
+1.733 bln
839.28%
jan 1, 1994
291.914 mln
-1.647 bln
-84.95%
jan 1, 1995
1.261 bln
+968.592 mln
331.81%
jan 1, 1996
2.494 bln
+1.233 bln
97.85%
jan 1, 1997
1.048 bln
-1.446 bln
-57.98%
jan 1, 1998
2.324 bln
+1.276 bln
121.72%
jan 1, 1999
1.634 bln
-689.598 mln
-29.68%
jan 1, 2000
1.584 bln
-49.822 mln
-3.05%
jan 1, 2001
277.179 mln
-1.307 bln
-82.5%
jan 1, 2002
-3.515 bln
-3.792 bln
-1.37K%
jan 1, 2003
-402.262 mln
+3.112 bln
-88.55%
jan 1, 2004
552.544 mln
+954.806 mln
-237.36%
jan 1, 2005
1.305 bln
+752.881 mln
136.26%
jan 1, 2006
909.414 mln
-396.01 mln
-30.34%
jan 1, 2007
5.929 bln
+5.019 bln
551.94%
jan 1, 2008
2.982 bln
-2.947 bln
-49.7%
jan 1, 2009
-2.12 bln
-5.102 bln
-171.08%
jan 1, 2010
1.311 bln
+3.431 bln
-161.87%
jan 1, 2011
-161.293 mln
-1.473 bln
-112.3%
jan 1, 2012
-153.398 mln
+7.895 mln
-4.89%
jan 1, 2013
2.899 bln
+3.052 bln
-1.99K%
jan 1, 2014
6.52 bln
+3.621 bln
124.91%
jan 1, 2015
7.692 bln
+1.172 bln
17.98%
jan 1, 2016
5.127 bln
-2.565 bln
-33.35%
Ranking of countries by current statistics by years


Comments: