29
/
en
AIzaSyAYiBZKx7MnpbEhh9jyipgxe19OcubqV5w
April 1, 2024
57037
South Asia
SAS
false
2
1
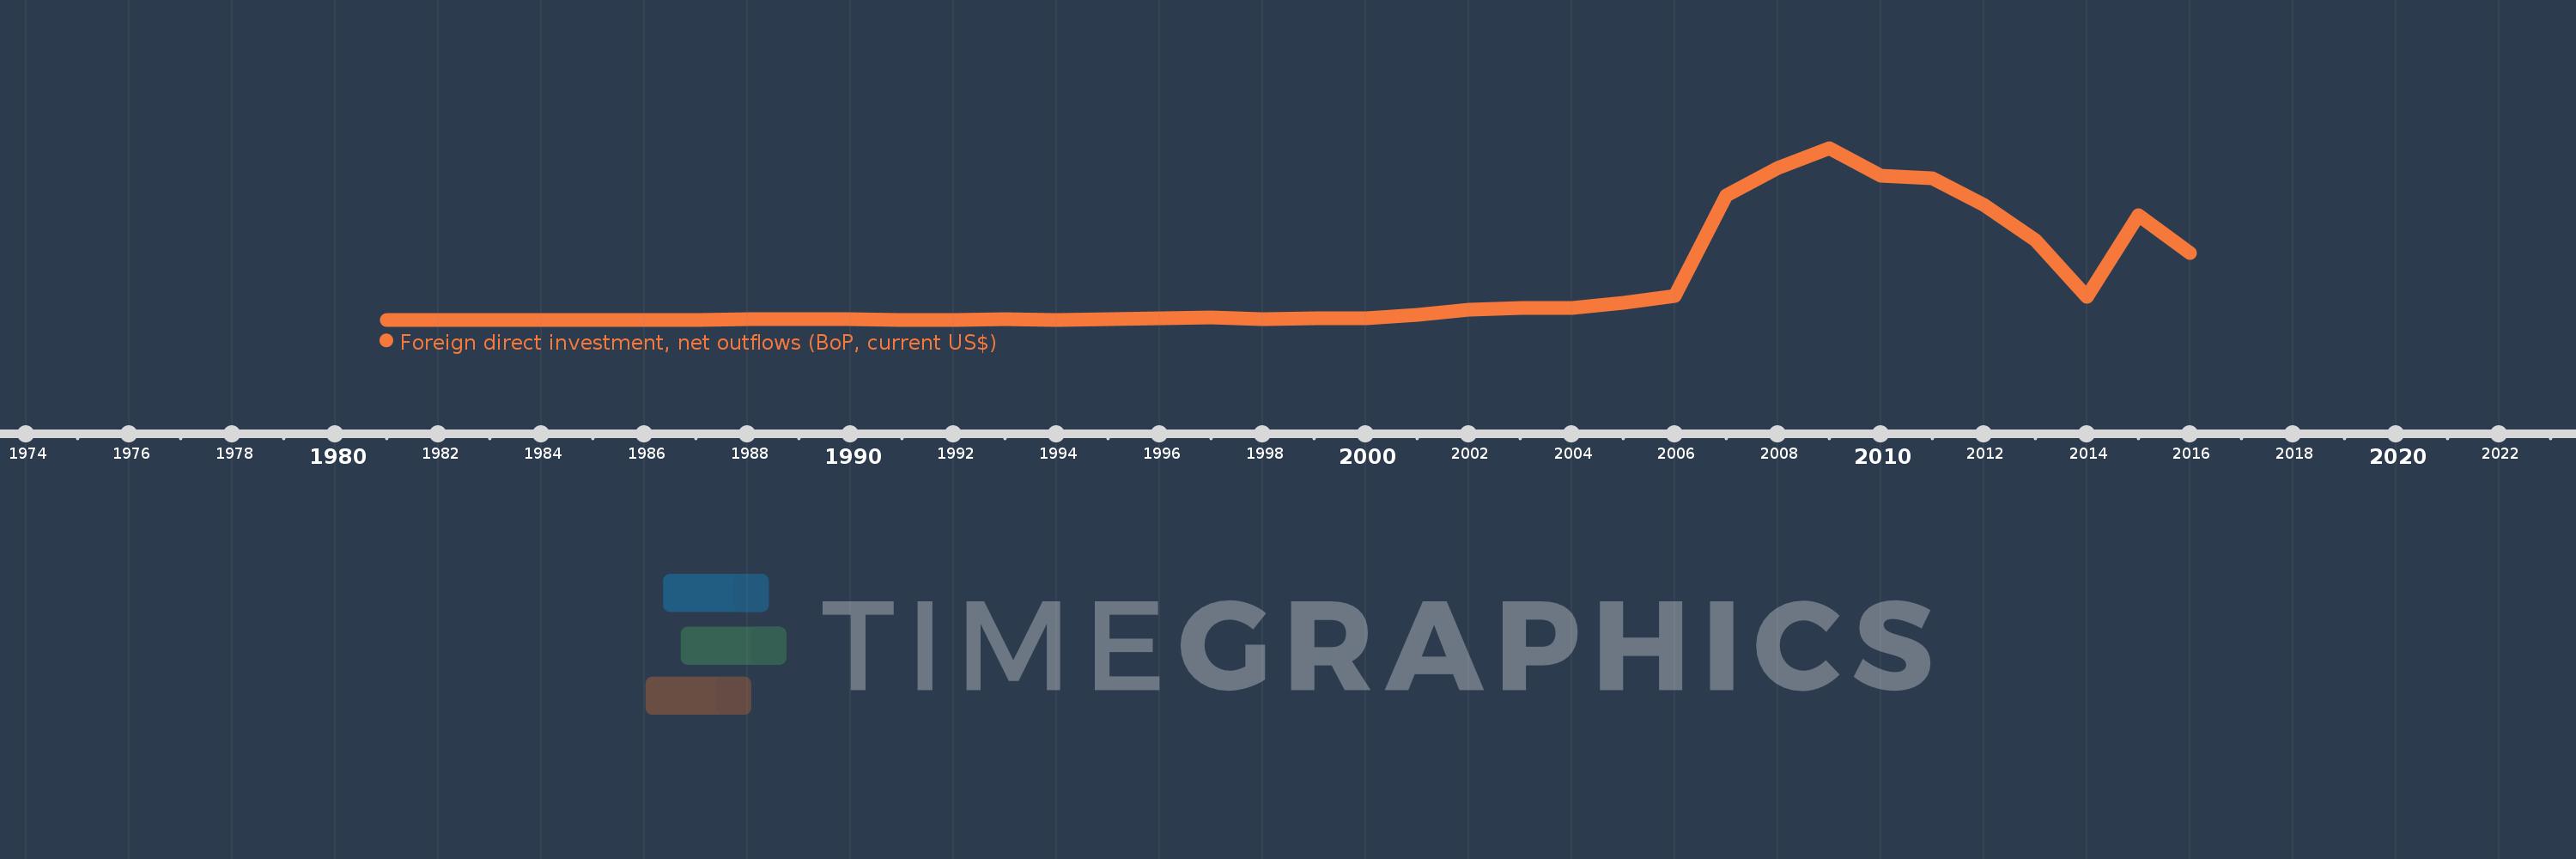
Foreign direct investment, net outflows (BoP, current US$)
2016,2015,2014,2013,2012,2011,2010,2009,2008,2007,2006,2005,2004,2003,2002,2001,2000,1999,1998,1997,1996,1995,1994,1993,1992,1991,1990,1989,1988,1987,1986,1985,1984,1983,1982,1981
This statistics in other country:
AfghanistanAlbaniaAlgeriaAngolaAntigua and BarbudaArab WorldArgentinaArmeniaArubaAustraliaAustriaAzerbaijanBahamas, TheBahrainBangladeshBarbadosBelarusBelgiumBelizeBeninBermudaBoliviaBosnia and HerzegovinaBotswanaBrazilBritish Virgin IslandsBrunei DarussalamBulgariaBurkina FasoBurundiCabo VerdeCambodiaCameroonCanadaCaribbean small statesCayman IslandsCentral African RepublicCentral Europe and the BalticsChadChileChinaColombiaComorosCongo, Dem. Rep.Congo, Rep.Costa RicaCote d'IvoireCroatiaCuracaoCyprusCzech RepublicDenmarkDominicaDominican RepublicEarly-demographic dividendEast Asia & PacificEast Asia & Pacific (excluding high income)East Asia & Pacific (IDA & IBRD countries)EcuadorEgypt, Arab Rep.El SalvadorEquatorial GuineaEritreaEstoniaEuro areaEurope & Central AsiaEurope & Central Asia (excluding high income)Europe & Central Asia (IDA & IBRD countries)European UnionFijiFinlandFragile and conflict affected situationsFranceFrench PolynesiaGabonGambia, TheGeorgiaGermanyGhanaGreeceGrenadaGuatemalaGuineaGuinea-BissauGuyanaHaitiHeavily indebted poor countries (HIPC)High incomeHondurasHong Kong SAR, ChinaHungaryIBRD onlyIcelandIDA & IBRD totalIDA blendIDA onlyIDA totalIndiaIndonesiaIran, Islamic Rep.IraqIrelandIsraelItalyJamaicaJapanJordanKazakhstanKenyaKiribatiKorea, Dem. People’s Rep.Korea, Rep.KosovoKuwaitKyrgyz RepublicLao PDRLate-demographic dividendLatin America & Caribbean Latin America & Caribbean (excluding high income)Latin America & the Caribbean (IDA & IBRD countries)LatviaLeast developed countries: UN classificationLebanonLesothoLiberiaLibyaLithuaniaLow & middle incomeLow incomeLower middle incomeLuxembourgMacao SAR, ChinaMacedonia, FYRMadagascarMalawiMalaysiaMaliMaltaMarshall IslandsMauritaniaMauritiusMexicoMicronesia, Fed. Sts.Middle East & North AfricaMiddle East & North Africa (excluding high income)Middle East & North Africa (IDA & IBRD countries)Middle incomeMoldovaMongoliaMontenegroMoroccoMozambiqueNamibiaNauruNetherlandsNew CaledoniaNew ZealandNicaraguaNigerNigeriaNorth AmericaNorthern Mariana IslandsNorwayOECD membersOmanOther small statesPacific island small statesPakistanPalauPanamaPapua New GuineaParaguayPeruPhilippinesPolandPortugalPost-demographic dividendPre-demographic dividendQatarRomaniaRussian FederationRwandaSamoaSao Tome and PrincipeSaudi ArabiaSenegalSerbiaSeychellesSierra LeoneSingaporeSint Maarten (Dutch part)Slovak RepublicSloveniaSmall statesSolomon IslandsSouth AfricaSouth AsiaSouth Asia (IDA & IBRD)SpainSri LankaSt. Kitts and NevisSt. LuciaSt. Vincent and the GrenadinesSub-Saharan Africa Sub-Saharan Africa (excluding high income)Sub-Saharan Africa (IDA & IBRD countries)SurinameSwazilandSwedenSwitzerlandSyrian Arab RepublicTajikistanTanzaniaThailandTimor-LesteTogoTongaTrinidad and TobagoTunisiaTurkeyUgandaUkraineUnited Arab EmiratesUnited KingdomUnited StatesUpper middle incomeUruguayVanuatuVenezuela, RBVietnamWest Bank and GazaWorldYemen, Rep.ZambiaZimbabwe Timeline:
This timeline shows a graph from 1981 to 2016 of South Asia. No data until 1980. Number of actual observations by date: 36.
Source name:
World Development Indicators
Source organization:
International Monetary Fund, Balance of Payments database, supplemented by data from the United Nations Conference on Trade and Development and official national sources.
Categories, topics:
Economy & Growth, Financial Sector
Last updated:
apr 23, 2017
Indicators value changes by year
Minimum:
-9.814 mln
jan 1, 1992
Maximum:
19.629 bln
jan 1, 2009
At the date of observation
Value
Absolute change
Change from previous value
jan 1, 1981
4.0 mln
+4.0 mln
0.0%
jan 1, 1982
2.0 mln
-2.0 mln
-50.0%
jan 1, 1983
1000.0K
-1000.0K
-50.0%
jan 1, 1984
5.0 mln
+4.0 mln
400.0%
jan 1, 1985
-684.41K
-5.684 mln
-113.69%
jan 1, 1986
-3.503 mln
-2.818 mln
411.79%
jan 1, 1987
-1.114 mln
+2.388 mln
-68.18%
jan 1, 1988
25.563 mln
+26.678 mln
-2.39K%
jan 1, 1989
25.84 mln
+277.086K
1.08%
jan 1, 1990
55.123 mln
+29.283 mln
113.32%
jan 1, 1991
9.271 mln
-45.852 mln
-83.18%
jan 1, 1992
-9.814 mln
-19.084 mln
-205.86%
jan 1, 1993
14.146 mln
+23.959 mln
-244.14%
jan 1, 1994
5.295 mln
-8.851 mln
-62.57%
jan 1, 1995
92.005 mln
+86.71 mln
1.64K%
jan 1, 1996
124.896 mln
+32.891 mln
35.75%
jan 1, 1997
265.529 mln
+140.633 mln
112.6%
jan 1, 1998
96.67 mln
-168.859 mln
-63.59%
jan 1, 1999
113.595 mln
+16.925 mln
17.51%
jan 1, 2000
124.417 mln
+10.822 mln
9.53%
jan 1, 2001
524.533 mln
+400.116 mln
321.59%
jan 1, 2002
1.101 bln
+576.2 mln
109.85%
jan 1, 2003
1.306 bln
+205.43 mln
18.66%
jan 1, 2004
1.288 bln
-18.23 mln
-1.4%
jan 1, 2005
1.902 bln
+614.288 mln
47.7%
jan 1, 2006
2.728 bln
+825.407 mln
43.39%
jan 1, 2007
14.179 bln
+11.451 bln
419.82%
jan 1, 2008
17.313 bln
+3.135 bln
22.11%
jan 1, 2009
19.629 bln
+2.316 bln
13.38%
jan 1, 2010
16.448 bln
-3.181 bln
-16.21%
jan 1, 2011
16.196 bln
-252.572 mln
-1.54%
jan 1, 2012
13.098 bln
-3.098 bln
-19.13%
jan 1, 2013
9.048 bln
-4.049 bln
-30.92%
jan 1, 2014
2.589 bln
-6.459 bln
-71.39%
jan 1, 2015
11.917 bln
+9.328 bln
360.31%
jan 1, 2016
7.64 bln
-4.277 bln
-35.89%
Ranking of countries by current statistics by years


Comments: