29
/
en
AIzaSyAYiBZKx7MnpbEhh9jyipgxe19OcubqV5w
April 1, 2024
194210
Mauritius
MUS
true
2
1
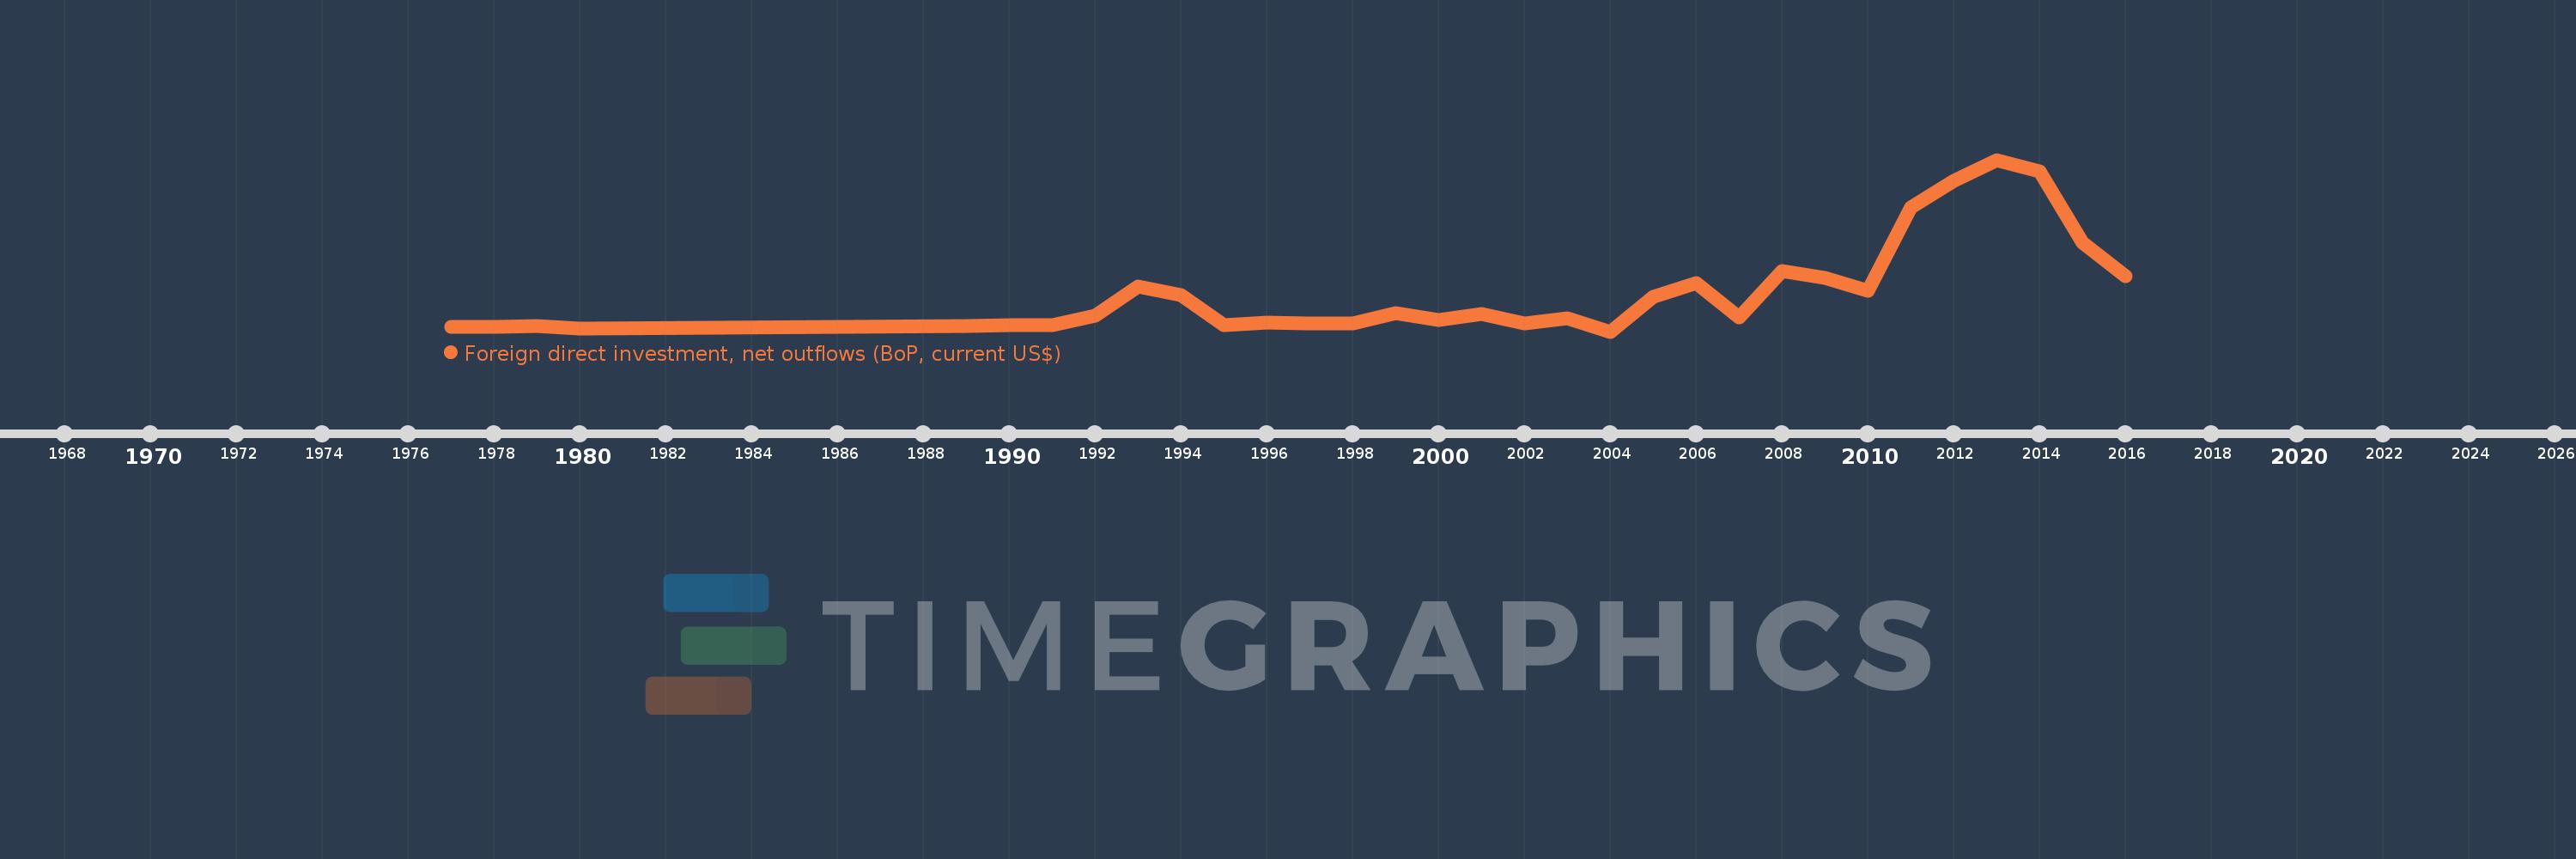
Foreign direct investment, net outflows (BoP, current US$)
2016,2015,2014,2013,2012,2011,2010,2009,2008,2007,2006,2005,2004,2003,2002,2001,2000,1999,1998,1997,1996,1995,1994,1993,1992,1991,1990,1989,1980,1979,1978,1977
This statistics in other country:
AfghanistanAlbaniaAlgeriaAngolaAntigua and BarbudaArab WorldArgentinaArmeniaArubaAustraliaAustriaAzerbaijanBahamas, TheBahrainBangladeshBarbadosBelarusBelgiumBelizeBeninBermudaBoliviaBosnia and HerzegovinaBotswanaBrazilBritish Virgin IslandsBrunei DarussalamBulgariaBurkina FasoBurundiCabo VerdeCambodiaCameroonCanadaCaribbean small statesCayman IslandsCentral African RepublicCentral Europe and the BalticsChadChileChinaColombiaComorosCongo, Dem. Rep.Congo, Rep.Costa RicaCote d'IvoireCroatiaCuracaoCyprusCzech RepublicDenmarkDominicaDominican RepublicEarly-demographic dividendEast Asia & PacificEast Asia & Pacific (excluding high income)East Asia & Pacific (IDA & IBRD countries)EcuadorEgypt, Arab Rep.El SalvadorEquatorial GuineaEritreaEstoniaEuro areaEurope & Central AsiaEurope & Central Asia (excluding high income)Europe & Central Asia (IDA & IBRD countries)European UnionFijiFinlandFragile and conflict affected situationsFranceFrench PolynesiaGabonGambia, TheGeorgiaGermanyGhanaGreeceGrenadaGuatemalaGuineaGuinea-BissauGuyanaHaitiHeavily indebted poor countries (HIPC)High incomeHondurasHong Kong SAR, ChinaHungaryIBRD onlyIcelandIDA & IBRD totalIDA blendIDA onlyIDA totalIndiaIndonesiaIran, Islamic Rep.IraqIrelandIsraelItalyJamaicaJapanJordanKazakhstanKenyaKiribatiKorea, Dem. People’s Rep.Korea, Rep.KosovoKuwaitKyrgyz RepublicLao PDRLate-demographic dividendLatin America & Caribbean Latin America & Caribbean (excluding high income)Latin America & the Caribbean (IDA & IBRD countries)LatviaLeast developed countries: UN classificationLebanonLesothoLiberiaLibyaLithuaniaLow & middle incomeLow incomeLower middle incomeLuxembourgMacao SAR, ChinaMacedonia, FYRMadagascarMalawiMalaysiaMaliMaltaMarshall IslandsMauritaniaMauritiusMexicoMicronesia, Fed. Sts.Middle East & North AfricaMiddle East & North Africa (excluding high income)Middle East & North Africa (IDA & IBRD countries)Middle incomeMoldovaMongoliaMontenegroMoroccoMozambiqueNamibiaNauruNetherlandsNew CaledoniaNew ZealandNicaraguaNigerNigeriaNorth AmericaNorthern Mariana IslandsNorwayOECD membersOmanOther small statesPacific island small statesPakistanPalauPanamaPapua New GuineaParaguayPeruPhilippinesPolandPortugalPost-demographic dividendPre-demographic dividendQatarRomaniaRussian FederationRwandaSamoaSao Tome and PrincipeSaudi ArabiaSenegalSerbiaSeychellesSierra LeoneSingaporeSint Maarten (Dutch part)Slovak RepublicSloveniaSmall statesSolomon IslandsSouth AfricaSouth AsiaSouth Asia (IDA & IBRD)SpainSri LankaSt. Kitts and NevisSt. LuciaSt. Vincent and the GrenadinesSub-Saharan Africa Sub-Saharan Africa (excluding high income)Sub-Saharan Africa (IDA & IBRD countries)SurinameSwazilandSwedenSwitzerlandSyrian Arab RepublicTajikistanTanzaniaThailandTimor-LesteTogoTongaTrinidad and TobagoTunisiaTurkeyUgandaUkraineUnited Arab EmiratesUnited KingdomUnited StatesUpper middle incomeUruguayVanuatuVenezuela, RBVietnamWest Bank and GazaWorldYemen, Rep.ZambiaZimbabwe Timeline:
This timeline shows a graph from 1977 to 2016 of Mauritius. No data until 1976. Number of actual observations by date: 32.
Source name:
World Development Indicators
Source organization:
International Monetary Fund, Balance of Payments database, supplemented by data from the United Nations Conference on Trade and Development and official national sources.
Categories, topics:
Economy & Growth, Financial Sector
Last updated:
apr 23, 2017
Indicators value changes by year
Minimum:
-6.018 mln
jan 1, 2004
Maximum:
180.366 mln
jan 1, 2013
At the date of observation
Value
Absolute change
Change from previous value
jan 1, 1977
-448.999K
-448.999K
0.0%
jan 1, 1978
-756.738K
-307.739K
68.54%
jan 1, 1979
-162.251K
+594.486K
-78.56%
jan 1, 1980
-2.536 mln
-2.374 mln
1.46K%
jan 1, 1989
148.835K
+2.685 mln
-105.87%
jan 1, 1990
590.173K
+441.338K
296.53%
jan 1, 1991
605.511K
+15.339K
2.6%
jan 1, 1992
10.861 mln
+10.256 mln
1.69K%
jan 1, 1993
43.307 mln
+32.446 mln
298.74%
jan 1, 1994
33.205 mln
-10.102 mln
-23.33%
jan 1, 1995
1.058 mln
-32.147 mln
-96.81%
jan 1, 1996
3.624 mln
+2.566 mln
242.53%
jan 1, 1997
2.674 mln
-949.156K
-26.19%
jan 1, 1998
3.182 mln
+507.418K
18.97%
jan 1, 1999
13.713 mln
+10.531 mln
330.97%
jan 1, 2000
6.432 mln
-7.28 mln
-53.09%
jan 1, 2001
12.952 mln
+6.52 mln
101.36%
jan 1, 2002
2.868 mln
-10.084 mln
-77.86%
jan 1, 2003
8.698 mln
+5.83 mln
203.27%
jan 1, 2004
-6.018 mln
-14.715 mln
-169.19%
jan 1, 2005
31.787 mln
+37.804 mln
-628.22%
jan 1, 2006
46.964 mln
+15.178 mln
47.75%
jan 1, 2007
9.591 mln
-37.374 mln
-79.58%
jan 1, 2008
59.575 mln
+49.984 mln
521.17%
jan 1, 2009
52.427 mln
-7.148 mln
-12.0%
jan 1, 2010
37.839 mln
-14.588 mln
-27.83%
jan 1, 2011
128.653 mln
+90.814 mln
240.0%
jan 1, 2012
157.807 mln
+29.154 mln
22.66%
jan 1, 2013
180.366 mln
+22.559 mln
14.3%
jan 1, 2014
167.875 mln
-12.491 mln
-6.93%
jan 1, 2015
90.818 mln
-77.057 mln
-45.9%
jan 1, 2016
53.862 mln
-36.956 mln
-40.69%
Ranking of countries by current statistics by years


Comments: