29
/
en
AIzaSyAYiBZKx7MnpbEhh9jyipgxe19OcubqV5w
April 1, 2024
216409
Pakistan
PAK
true
2
1
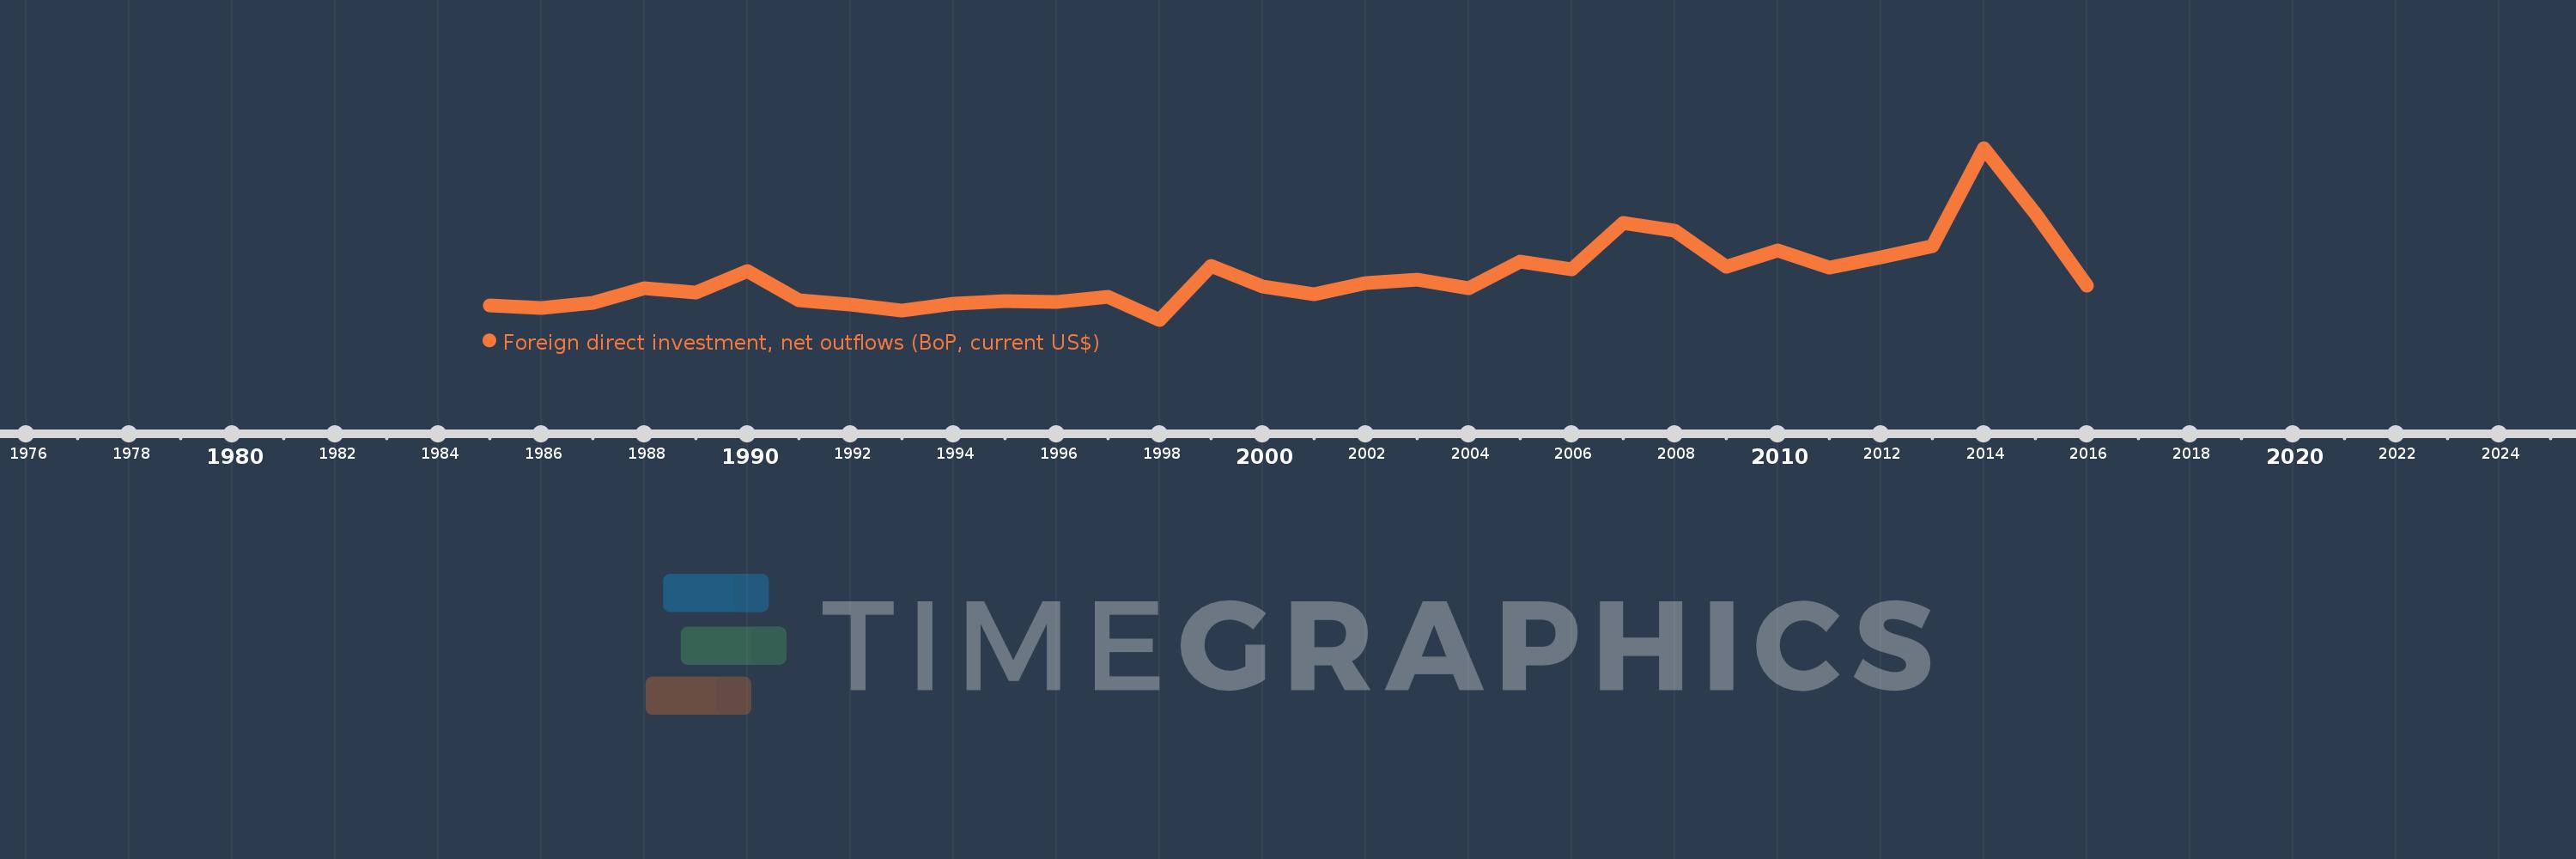
Foreign direct investment, net outflows (BoP, current US$)
2016,2015,2014,2013,2012,2011,2010,2009,2008,2007,2006,2005,2004,2003,2002,2001,2000,1999,1998,1997,1996,1995,1994,1993,1992,1991,1990,1989,1988,1987,1986,1985
This statistics in other country:
AfghanistanAlbaniaAlgeriaAngolaAntigua and BarbudaArab WorldArgentinaArmeniaArubaAustraliaAustriaAzerbaijanBahamas, TheBahrainBangladeshBarbadosBelarusBelgiumBelizeBeninBermudaBoliviaBosnia and HerzegovinaBotswanaBrazilBritish Virgin IslandsBrunei DarussalamBulgariaBurkina FasoBurundiCabo VerdeCambodiaCameroonCanadaCaribbean small statesCayman IslandsCentral African RepublicCentral Europe and the BalticsChadChileChinaColombiaComorosCongo, Dem. Rep.Congo, Rep.Costa RicaCote d'IvoireCroatiaCuracaoCyprusCzech RepublicDenmarkDominicaDominican RepublicEarly-demographic dividendEast Asia & PacificEast Asia & Pacific (excluding high income)East Asia & Pacific (IDA & IBRD countries)EcuadorEgypt, Arab Rep.El SalvadorEquatorial GuineaEritreaEstoniaEuro areaEurope & Central AsiaEurope & Central Asia (excluding high income)Europe & Central Asia (IDA & IBRD countries)European UnionFijiFinlandFragile and conflict affected situationsFranceFrench PolynesiaGabonGambia, TheGeorgiaGermanyGhanaGreeceGrenadaGuatemalaGuineaGuinea-BissauGuyanaHaitiHeavily indebted poor countries (HIPC)High incomeHondurasHong Kong SAR, ChinaHungaryIBRD onlyIcelandIDA & IBRD totalIDA blendIDA onlyIDA totalIndiaIndonesiaIran, Islamic Rep.IraqIrelandIsraelItalyJamaicaJapanJordanKazakhstanKenyaKiribatiKorea, Dem. People’s Rep.Korea, Rep.KosovoKuwaitKyrgyz RepublicLao PDRLate-demographic dividendLatin America & Caribbean Latin America & Caribbean (excluding high income)Latin America & the Caribbean (IDA & IBRD countries)LatviaLeast developed countries: UN classificationLebanonLesothoLiberiaLibyaLithuaniaLow & middle incomeLow incomeLower middle incomeLuxembourgMacao SAR, ChinaMacedonia, FYRMadagascarMalawiMalaysiaMaliMaltaMarshall IslandsMauritaniaMauritiusMexicoMicronesia, Fed. Sts.Middle East & North AfricaMiddle East & North Africa (excluding high income)Middle East & North Africa (IDA & IBRD countries)Middle incomeMoldovaMongoliaMontenegroMoroccoMozambiqueNamibiaNauruNetherlandsNew CaledoniaNew ZealandNicaraguaNigerNigeriaNorth AmericaNorthern Mariana IslandsNorwayOECD membersOmanOther small statesPacific island small statesPakistanPalauPanamaPapua New GuineaParaguayPeruPhilippinesPolandPortugalPost-demographic dividendPre-demographic dividendQatarRomaniaRussian FederationRwandaSamoaSao Tome and PrincipeSaudi ArabiaSenegalSerbiaSeychellesSierra LeoneSingaporeSint Maarten (Dutch part)Slovak RepublicSloveniaSmall statesSolomon IslandsSouth AfricaSouth AsiaSouth Asia (IDA & IBRD)SpainSri LankaSt. Kitts and NevisSt. LuciaSt. Vincent and the GrenadinesSub-Saharan Africa Sub-Saharan Africa (excluding high income)Sub-Saharan Africa (IDA & IBRD countries)SurinameSwazilandSwedenSwitzerlandSyrian Arab RepublicTajikistanTanzaniaThailandTimor-LesteTogoTongaTrinidad and TobagoTunisiaTurkeyUgandaUkraineUnited Arab EmiratesUnited KingdomUnited StatesUpper middle incomeUruguayVanuatuVenezuela, RBVietnamWest Bank and GazaWorldYemen, Rep.ZambiaZimbabwe Timeline:
This timeline shows a graph from 1985 to 2016 of Pakistan. No data until 1984. Number of actual observations by date: 32.
Source name:
World Development Indicators
Source organization:
International Monetary Fund, Balance of Payments database, supplemented by data from the United Nations Conference on Trade and Development and official national sources.
Categories, topics:
Economy & Growth, Financial Sector
Last updated:
apr 23, 2017
Indicators value changes by year
Minimum:
-24.314 mln
jan 1, 1998
Maximum:
212.0 mln
jan 1, 2014
At the date of observation
Value
Absolute change
Change from previous value
jan 1, 1985
-4.684 mln
-4.684 mln
0.0%
jan 1, 1986
-7.866 mln
-3.182 mln
67.92%
jan 1, 1987
-649.653K
+7.216 mln
-91.74%
jan 1, 1988
19.227 mln
+19.877 mln
-3.06K%
jan 1, 1989
12.741 mln
-6.485 mln
-33.73%
jan 1, 1990
43.083 mln
+30.342 mln
238.13%
jan 1, 1991
1.948 mln
-41.135 mln
-95.48%
jan 1, 1992
-3.737 mln
-5.686 mln
-291.82%
jan 1, 1993
-11.58 mln
-7.843 mln
209.85%
jan 1, 1994
-2.153 mln
+9.426 mln
-81.4%
jan 1, 1995
966.634K
+3.12 mln
-144.89%
jan 1, 1996
410.453K
-556.181K
-57.54%
jan 1, 1997
6.785 mln
+6.375 mln
1.55K%
jan 1, 1998
-24.314 mln
-31.1 mln
-458.33%
jan 1, 1999
50.0 mln
+74.314 mln
-305.64%
jan 1, 2000
21.0 mln
-29.0 mln
-58.0%
jan 1, 2001
11.0 mln
-10.0 mln
-47.62%
jan 1, 2002
26.0 mln
+15.0 mln
136.36%
jan 1, 2003
31.0 mln
+5.0 mln
19.23%
jan 1, 2004
19.0 mln
-12.0 mln
-38.71%
jan 1, 2005
56.0 mln
+37.0 mln
194.74%
jan 1, 2006
45.0 mln
-11.0 mln
-19.64%
jan 1, 2007
109.0 mln
+64.0 mln
142.22%
jan 1, 2008
98.0 mln
-11.0 mln
-10.09%
jan 1, 2009
49.0 mln
-49.0 mln
-50.0%
jan 1, 2010
71.0 mln
+22.0 mln
44.9%
jan 1, 2011
47.0 mln
-24.0 mln
-33.8%
jan 1, 2012
62.0 mln
+15.0 mln
31.91%
jan 1, 2013
77.0 mln
+15.0 mln
24.19%
jan 1, 2014
212.0 mln
+135.0 mln
175.32%
jan 1, 2015
122.0 mln
-90.0 mln
-42.45%
jan 1, 2016
23.0 mln
-99.0 mln
-81.15%
Ranking of countries by current statistics by years


Comments: