29
/
en
AIzaSyAYiBZKx7MnpbEhh9jyipgxe19OcubqV5w
April 1, 2024
240438
Singapore
SGP
true
2
1
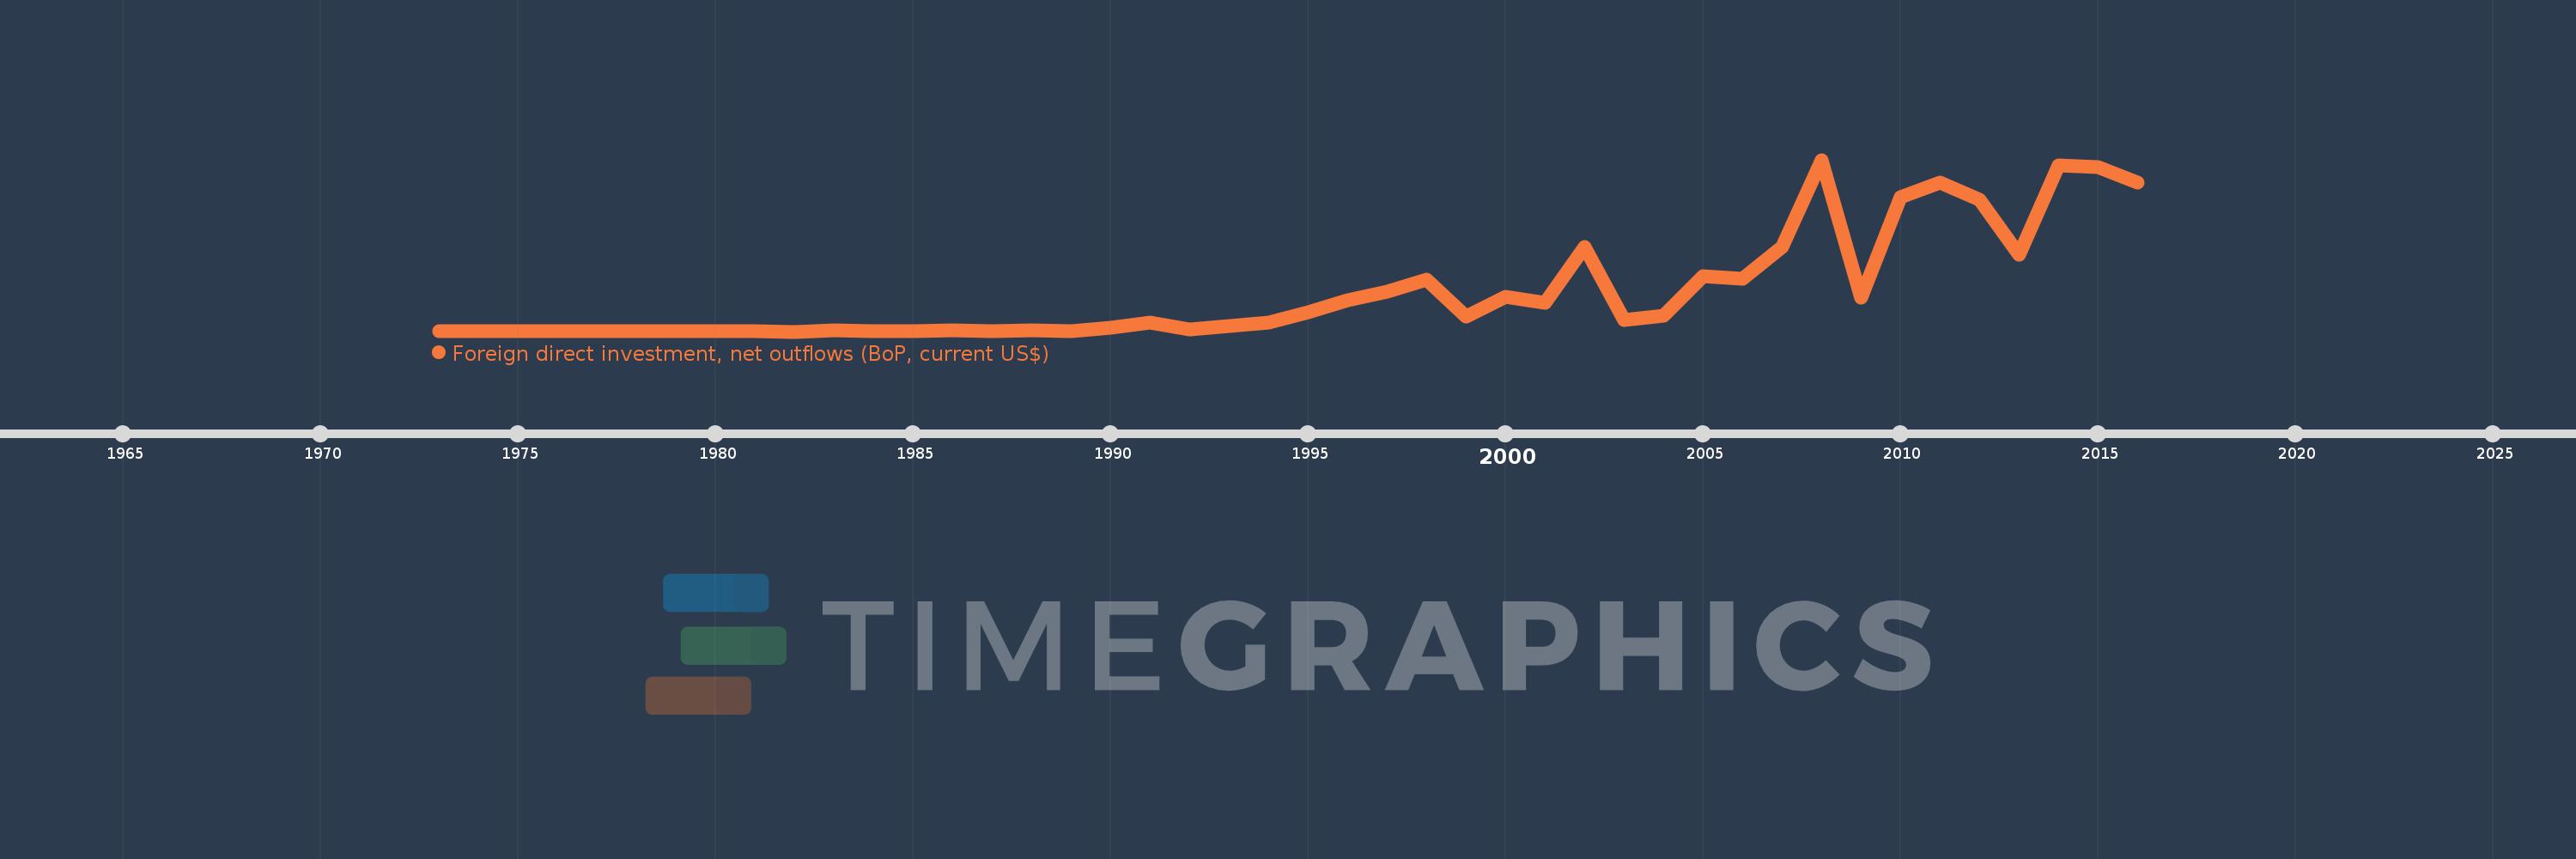
Foreign direct investment, net outflows (BoP, current US$)
2016,2015,2014,2013,2012,2011,2010,2009,2008,2007,2006,2005,2004,2003,2002,2001,2000,1999,1998,1997,1996,1995,1994,1993,1992,1991,1990,1989,1988,1987,1986,1985,1984,1983,1982,1981,1980,1979,1978,1977,1976,1975,1974,1973
This statistics in other country:
AfghanistanAlbaniaAlgeriaAngolaAntigua and BarbudaArab WorldArgentinaArmeniaArubaAustraliaAustriaAzerbaijanBahamas, TheBahrainBangladeshBarbadosBelarusBelgiumBelizeBeninBermudaBoliviaBosnia and HerzegovinaBotswanaBrazilBritish Virgin IslandsBrunei DarussalamBulgariaBurkina FasoBurundiCabo VerdeCambodiaCameroonCanadaCaribbean small statesCayman IslandsCentral African RepublicCentral Europe and the BalticsChadChileChinaColombiaComorosCongo, Dem. Rep.Congo, Rep.Costa RicaCote d'IvoireCroatiaCuracaoCyprusCzech RepublicDenmarkDominicaDominican RepublicEarly-demographic dividendEast Asia & PacificEast Asia & Pacific (excluding high income)East Asia & Pacific (IDA & IBRD countries)EcuadorEgypt, Arab Rep.El SalvadorEquatorial GuineaEritreaEstoniaEuro areaEurope & Central AsiaEurope & Central Asia (excluding high income)Europe & Central Asia (IDA & IBRD countries)European UnionFijiFinlandFragile and conflict affected situationsFranceFrench PolynesiaGabonGambia, TheGeorgiaGermanyGhanaGreeceGrenadaGuatemalaGuineaGuinea-BissauGuyanaHaitiHeavily indebted poor countries (HIPC)High incomeHondurasHong Kong SAR, ChinaHungaryIBRD onlyIcelandIDA & IBRD totalIDA blendIDA onlyIDA totalIndiaIndonesiaIran, Islamic Rep.IraqIrelandIsraelItalyJamaicaJapanJordanKazakhstanKenyaKiribatiKorea, Dem. People’s Rep.Korea, Rep.KosovoKuwaitKyrgyz RepublicLao PDRLate-demographic dividendLatin America & Caribbean Latin America & Caribbean (excluding high income)Latin America & the Caribbean (IDA & IBRD countries)LatviaLeast developed countries: UN classificationLebanonLesothoLiberiaLibyaLithuaniaLow & middle incomeLow incomeLower middle incomeLuxembourgMacao SAR, ChinaMacedonia, FYRMadagascarMalawiMalaysiaMaliMaltaMarshall IslandsMauritaniaMauritiusMexicoMicronesia, Fed. Sts.Middle East & North AfricaMiddle East & North Africa (excluding high income)Middle East & North Africa (IDA & IBRD countries)Middle incomeMoldovaMongoliaMontenegroMoroccoMozambiqueNamibiaNauruNetherlandsNew CaledoniaNew ZealandNicaraguaNigerNigeriaNorth AmericaNorthern Mariana IslandsNorwayOECD membersOmanOther small statesPacific island small statesPakistanPalauPanamaPapua New GuineaParaguayPeruPhilippinesPolandPortugalPost-demographic dividendPre-demographic dividendQatarRomaniaRussian FederationRwandaSamoaSao Tome and PrincipeSaudi ArabiaSenegalSerbiaSeychellesSierra LeoneSingaporeSint Maarten (Dutch part)Slovak RepublicSloveniaSmall statesSolomon IslandsSouth AfricaSouth AsiaSouth Asia (IDA & IBRD)SpainSri LankaSt. Kitts and NevisSt. LuciaSt. Vincent and the GrenadinesSub-Saharan Africa Sub-Saharan Africa (excluding high income)Sub-Saharan Africa (IDA & IBRD countries)SurinameSwazilandSwedenSwitzerlandSyrian Arab RepublicTajikistanTanzaniaThailandTimor-LesteTogoTongaTrinidad and TobagoTunisiaTurkeyUgandaUkraineUnited Arab EmiratesUnited KingdomUnited StatesUpper middle incomeUruguayVanuatuVenezuela, RBVietnamWest Bank and GazaWorldYemen, Rep.ZambiaZimbabwe Timeline:
This timeline shows a graph from 1973 to 2016 of Singapore. No data until 1972. Number of actual observations by date: 44.
Source name:
World Development Indicators
Source organization:
International Monetary Fund, Balance of Payments database, supplemented by data from the United Nations Conference on Trade and Development and official national sources.
Categories, topics:
Economy & Growth, Financial Sector
Last updated:
apr 23, 2017
Indicators value changes by year
Minimum:
-14.673 mln
jan 1, 1982
Maximum:
40.882 bln
jan 1, 2008
At the date of observation
Value
Absolute change
Change from previous value
jan 1, 1973
20.267 mln
+20.267 mln
0.0%
jan 1, 1974
26.044 mln
+5.777 mln
28.51%
jan 1, 1975
29.957 mln
+3.912 mln
15.02%
jan 1, 1976
37.954 mln
+7.997 mln
26.7%
jan 1, 1977
44.924 mln
+6.97 mln
18.36%
jan 1, 1978
85.267 mln
+40.343 mln
89.8%
jan 1, 1979
113.455 mln
+28.188 mln
33.06%
jan 1, 1980
167.39 mln
+53.935 mln
47.54%
jan 1, 1981
97.608 mln
-69.782 mln
-41.69%
jan 1, 1982
-14.673 mln
-112.282 mln
-115.03%
jan 1, 1983
304.202 mln
+318.875 mln
-2.17K%
jan 1, 1984
49.218 mln
-254.984 mln
-83.82%
jan 1, 1985
92.355 mln
+43.137 mln
87.64%
jan 1, 1986
237.711 mln
+145.356 mln
157.39%
jan 1, 1987
181.408 mln
-56.303 mln
-23.69%
jan 1, 1988
206.08 mln
+24.672 mln
13.6%
jan 1, 1989
117.768 mln
-88.311 mln
-42.85%
jan 1, 1990
882.191 mln
+764.422 mln
649.09%
jan 1, 1991
2.034 bln
+1.152 bln
130.54%
jan 1, 1992
525.831 mln
-1.508 bln
-74.15%
jan 1, 1993
1.317 bln
+791.138 mln
150.45%
jan 1, 1994
2.152 bln
+834.918 mln
63.4%
jan 1, 1995
4.577 bln
+2.425 bln
112.7%
jan 1, 1996
7.479 bln
+2.902 bln
63.41%
jan 1, 1997
9.404 bln
+1.924 bln
25.73%
jan 1, 1998
12.423 bln
+3.019 bln
32.1%
jan 1, 1999
3.621 bln
-8.802 bln
-70.85%
jan 1, 2000
8.31 bln
+4.689 bln
129.48%
jan 1, 2001
6.848 bln
-1.462 bln
-17.59%
jan 1, 2002
20.204 bln
+13.356 bln
195.03%
jan 1, 2003
2.835 bln
-17.369 bln
-85.97%
jan 1, 2004
3.726 bln
+890.458 mln
31.41%
jan 1, 2005
13.139 bln
+9.413 bln
252.64%
jan 1, 2006
12.553 bln
-586.05 mln
-4.46%
jan 1, 2007
20.063 bln
+7.511 bln
59.83%
jan 1, 2008
40.882 bln
+20.819 bln
103.77%
jan 1, 2009
7.964 bln
-32.918 bln
-80.52%
jan 1, 2010
32.04 bln
+24.075 bln
302.29%
jan 1, 2011
35.407 bln
+3.368 bln
10.51%
jan 1, 2012
31.459 bln
-3.948 bln
-11.15%
jan 1, 2013
18.341 bln
-13.119 bln
-41.7%
jan 1, 2014
39.592 bln
+21.251 bln
115.87%
jan 1, 2015
39.131 bln
-460.655 mln
-1.16%
jan 1, 2016
35.485 bln
-3.646 bln
-9.32%
Ranking of countries by current statistics by years


Comments: