29
/
en
AIzaSyAYiBZKx7MnpbEhh9jyipgxe19OcubqV5w
April 1, 2024
234625
Saudi Arabia
SAU
true
2
1
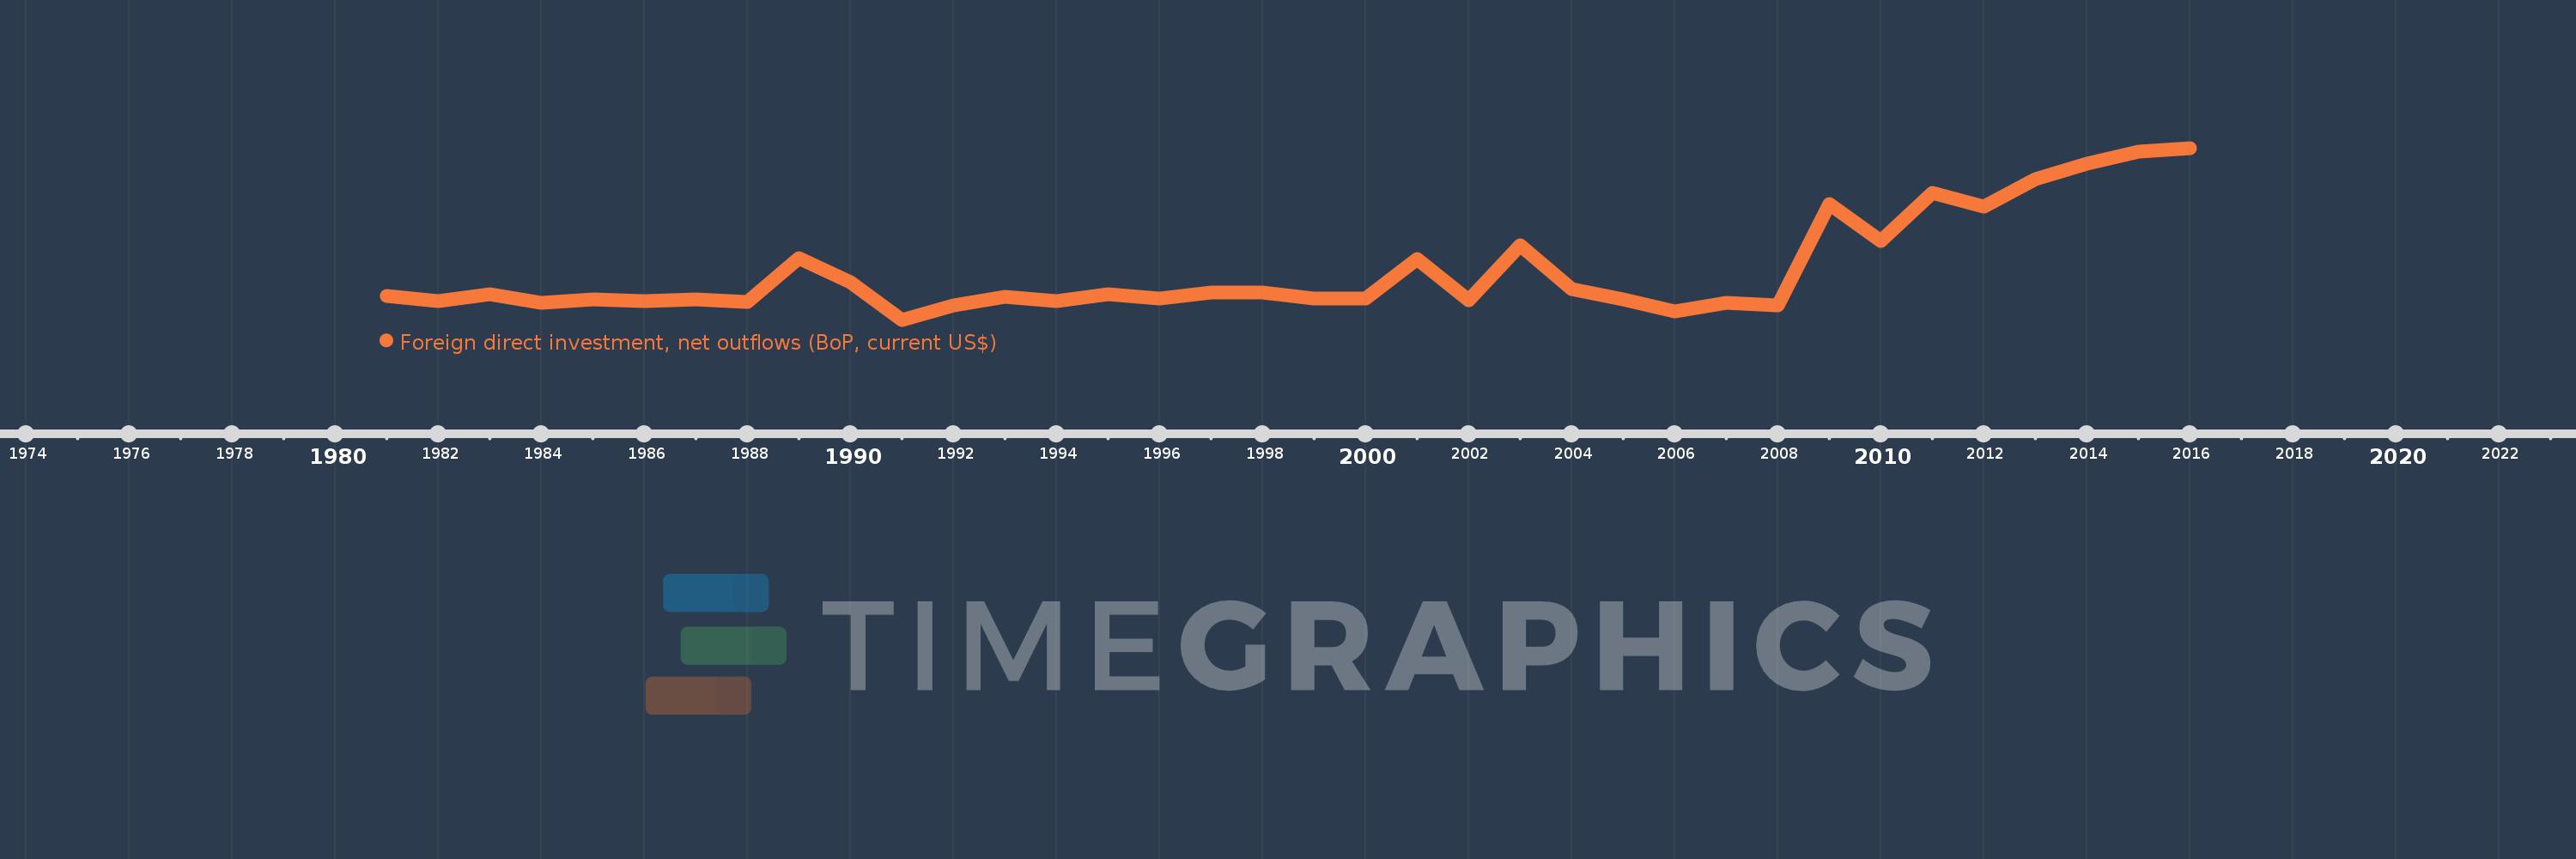
Foreign direct investment, net outflows (BoP, current US$)
2016,2015,2014,2013,2012,2011,2010,2009,2008,2007,2006,2005,2004,2003,2002,2001,2000,1999,1998,1997,1996,1995,1994,1993,1992,1991,1990,1989,1988,1987,1986,1985,1984,1983,1982,1981
This statistics in other country:
AfghanistanAlbaniaAlgeriaAngolaAntigua and BarbudaArab WorldArgentinaArmeniaArubaAustraliaAustriaAzerbaijanBahamas, TheBahrainBangladeshBarbadosBelarusBelgiumBelizeBeninBermudaBoliviaBosnia and HerzegovinaBotswanaBrazilBritish Virgin IslandsBrunei DarussalamBulgariaBurkina FasoBurundiCabo VerdeCambodiaCameroonCanadaCaribbean small statesCayman IslandsCentral African RepublicCentral Europe and the BalticsChadChileChinaColombiaComorosCongo, Dem. Rep.Congo, Rep.Costa RicaCote d'IvoireCroatiaCuracaoCyprusCzech RepublicDenmarkDominicaDominican RepublicEarly-demographic dividendEast Asia & PacificEast Asia & Pacific (excluding high income)East Asia & Pacific (IDA & IBRD countries)EcuadorEgypt, Arab Rep.El SalvadorEquatorial GuineaEritreaEstoniaEuro areaEurope & Central AsiaEurope & Central Asia (excluding high income)Europe & Central Asia (IDA & IBRD countries)European UnionFijiFinlandFragile and conflict affected situationsFranceFrench PolynesiaGabonGambia, TheGeorgiaGermanyGhanaGreeceGrenadaGuatemalaGuineaGuinea-BissauGuyanaHaitiHeavily indebted poor countries (HIPC)High incomeHondurasHong Kong SAR, ChinaHungaryIBRD onlyIcelandIDA & IBRD totalIDA blendIDA onlyIDA totalIndiaIndonesiaIran, Islamic Rep.IraqIrelandIsraelItalyJamaicaJapanJordanKazakhstanKenyaKiribatiKorea, Dem. People’s Rep.Korea, Rep.KosovoKuwaitKyrgyz RepublicLao PDRLate-demographic dividendLatin America & Caribbean Latin America & Caribbean (excluding high income)Latin America & the Caribbean (IDA & IBRD countries)LatviaLeast developed countries: UN classificationLebanonLesothoLiberiaLibyaLithuaniaLow & middle incomeLow incomeLower middle incomeLuxembourgMacao SAR, ChinaMacedonia, FYRMadagascarMalawiMalaysiaMaliMaltaMarshall IslandsMauritaniaMauritiusMexicoMicronesia, Fed. Sts.Middle East & North AfricaMiddle East & North Africa (excluding high income)Middle East & North Africa (IDA & IBRD countries)Middle incomeMoldovaMongoliaMontenegroMoroccoMozambiqueNamibiaNauruNetherlandsNew CaledoniaNew ZealandNicaraguaNigerNigeriaNorth AmericaNorthern Mariana IslandsNorwayOECD membersOmanOther small statesPacific island small statesPakistanPalauPanamaPapua New GuineaParaguayPeruPhilippinesPolandPortugalPost-demographic dividendPre-demographic dividendQatarRomaniaRussian FederationRwandaSamoaSao Tome and PrincipeSaudi ArabiaSenegalSerbiaSeychellesSierra LeoneSingaporeSint Maarten (Dutch part)Slovak RepublicSloveniaSmall statesSolomon IslandsSouth AfricaSouth AsiaSouth Asia (IDA & IBRD)SpainSri LankaSt. Kitts and NevisSt. LuciaSt. Vincent and the GrenadinesSub-Saharan Africa Sub-Saharan Africa (excluding high income)Sub-Saharan Africa (IDA & IBRD countries)SurinameSwazilandSwedenSwitzerlandSyrian Arab RepublicTajikistanTanzaniaThailandTimor-LesteTogoTongaTrinidad and TobagoTunisiaTurkeyUgandaUkraineUnited Arab EmiratesUnited KingdomUnited StatesUpper middle incomeUruguayVanuatuVenezuela, RBVietnamWest Bank and GazaWorldYemen, Rep.ZambiaZimbabwe Timeline:
This timeline shows a graph from 1981 to 2016 of Saudi Arabia. No data until 1980. Number of actual observations by date: 36.
Source name:
World Development Indicators
Source organization:
International Monetary Fund, Balance of Payments database, supplemented by data from the United Nations Conference on Trade and Development and official national sources.
Categories, topics:
Economy & Growth, Financial Sector
Last updated:
apr 23, 2017
Indicators value changes by year
Minimum:
-638.331 mln
jan 1, 1991
Maximum:
5.52 bln
jan 1, 2016
At the date of observation
Value
Absolute change
Change from previous value
jan 1, 1981
211.462 mln
+211.462 mln
0.0%
jan 1, 1982
22.316 mln
-189.145 mln
-89.45%
jan 1, 1983
265.288 mln
+242.972 mln
1.09K%
jan 1, 1984
-34.274 mln
-299.562 mln
-112.92%
jan 1, 1985
78.377 mln
+112.651 mln
-328.68%
jan 1, 1986
43.86 mln
-34.517 mln
-44.04%
jan 1, 1987
96.948 mln
+53.087 mln
121.04%
jan 1, 1988
11.97 mln
-84.977 mln
-87.65%
jan 1, 1989
1.566 bln
+1.554 bln
12.98K%
jan 1, 1990
704.263 mln
-861.982 mln
-55.03%
jan 1, 1991
-638.331 mln
-1.343 bln
-190.64%
jan 1, 1992
-127.907 mln
+510.424 mln
-79.96%
jan 1, 1993
195.272 mln
+323.179 mln
-252.67%
jan 1, 1994
44.893 mln
-150.379 mln
-77.01%
jan 1, 1995
286.647 mln
+241.754 mln
538.51%
jan 1, 1996
119.574 mln
-167.072 mln
-58.29%
jan 1, 1997
323.406 mln
+203.831 mln
170.46%
jan 1, 1998
325.96 mln
+2.554 mln
0.79%
jan 1, 1999
127.898 mln
-198.062 mln
-60.76%
jan 1, 2000
110.681 mln
-17.216 mln
-13.46%
jan 1, 2001
1.55 bln
+1.439 bln
1.3K%
jan 1, 2002
45.629 mln
-1.504 bln
-97.06%
jan 1, 2003
2.02 bln
+1.974 bln
4.33K%
jan 1, 2004
473.0 mln
-1.547 bln
-76.58%
jan 1, 2005
78.735 mln
-394.265 mln
-83.35%
jan 1, 2006
-350.139 mln
-428.874 mln
-544.71%
jan 1, 2007
-38.611 mln
+311.528 mln
-88.97%
jan 1, 2008
-134.822 mln
-96.21 mln
249.18%
jan 1, 2009
3.498 bln
+3.632 bln
-2.69K%
jan 1, 2010
2.177 bln
-1.32 bln
-37.75%
jan 1, 2011
3.907 bln
+1.73 bln
79.44%
jan 1, 2012
3.43 bln
-476.93 mln
-12.21%
jan 1, 2013
4.402 bln
+971.63 mln
28.33%
jan 1, 2014
4.943 bln
+541.745 mln
12.31%
jan 1, 2015
5.396 bln
+452.697 mln
9.16%
jan 1, 2016
5.52 bln
+124.338 mln
2.3%
Ranking of countries by current statistics by years


Comments: