29
/
en
AIzaSyAYiBZKx7MnpbEhh9jyipgxe19OcubqV5w
April 1, 2024
167477
Kenya
KEN
true
2
1
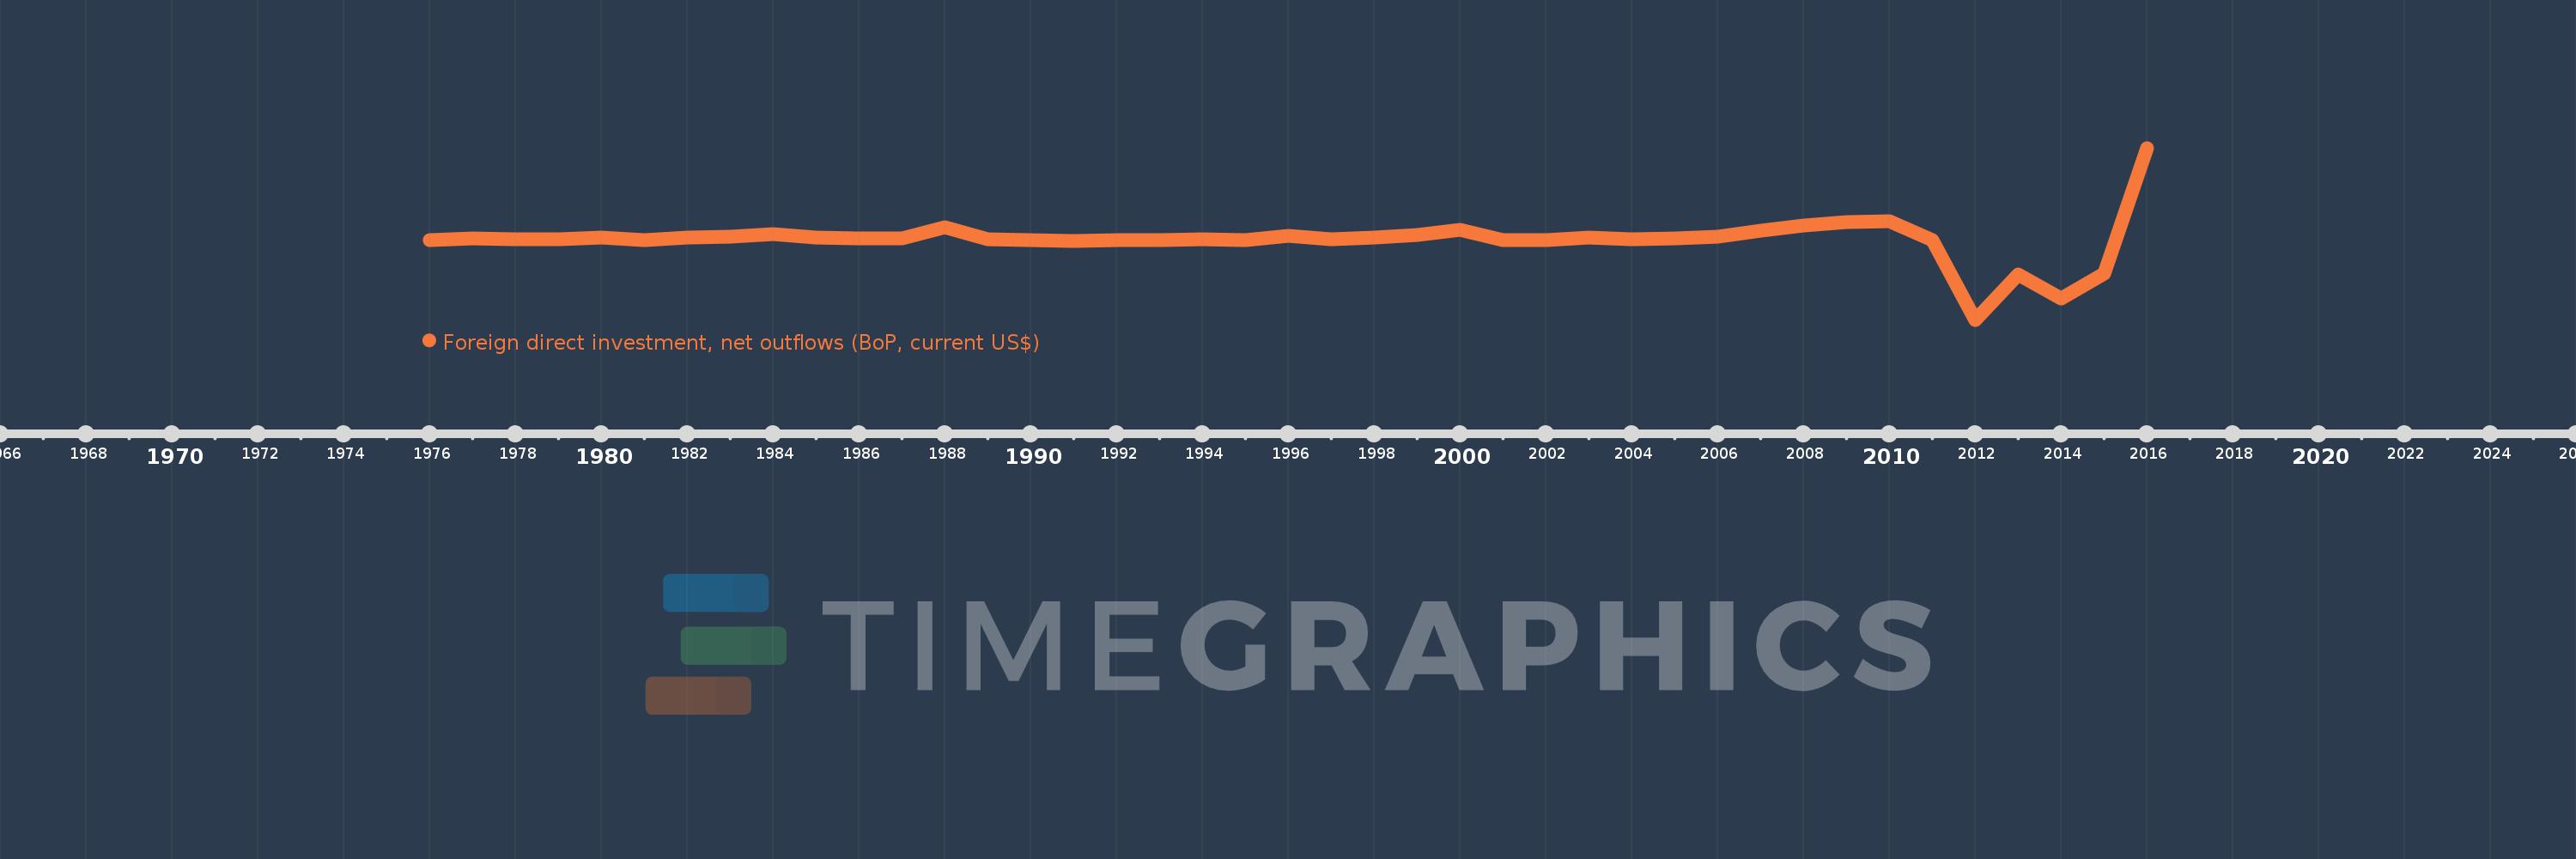
Foreign direct investment, net outflows (BoP, current US$)
2016,2015,2014,2013,2012,2011,2010,2009,2008,2007,2006,2005,2004,2003,2002,2001,2000,1999,1998,1997,1996,1995,1994,1993,1992,1991,1990,1989,1988,1987,1986,1985,1984,1983,1982,1981,1980,1979,1978,1977,1976
This statistics in other country:
AfghanistanAlbaniaAlgeriaAngolaAntigua and BarbudaArab WorldArgentinaArmeniaArubaAustraliaAustriaAzerbaijanBahamas, TheBahrainBangladeshBarbadosBelarusBelgiumBelizeBeninBermudaBoliviaBosnia and HerzegovinaBotswanaBrazilBritish Virgin IslandsBrunei DarussalamBulgariaBurkina FasoBurundiCabo VerdeCambodiaCameroonCanadaCaribbean small statesCayman IslandsCentral African RepublicCentral Europe and the BalticsChadChileChinaColombiaComorosCongo, Dem. Rep.Congo, Rep.Costa RicaCote d'IvoireCroatiaCuracaoCyprusCzech RepublicDenmarkDominicaDominican RepublicEarly-demographic dividendEast Asia & PacificEast Asia & Pacific (excluding high income)East Asia & Pacific (IDA & IBRD countries)EcuadorEgypt, Arab Rep.El SalvadorEquatorial GuineaEritreaEstoniaEuro areaEurope & Central AsiaEurope & Central Asia (excluding high income)Europe & Central Asia (IDA & IBRD countries)European UnionFijiFinlandFragile and conflict affected situationsFranceFrench PolynesiaGabonGambia, TheGeorgiaGermanyGhanaGreeceGrenadaGuatemalaGuineaGuinea-BissauGuyanaHaitiHeavily indebted poor countries (HIPC)High incomeHondurasHong Kong SAR, ChinaHungaryIBRD onlyIcelandIDA & IBRD totalIDA blendIDA onlyIDA totalIndiaIndonesiaIran, Islamic Rep.IraqIrelandIsraelItalyJamaicaJapanJordanKazakhstanKenyaKiribatiKorea, Dem. People’s Rep.Korea, Rep.KosovoKuwaitKyrgyz RepublicLao PDRLate-demographic dividendLatin America & Caribbean Latin America & Caribbean (excluding high income)Latin America & the Caribbean (IDA & IBRD countries)LatviaLeast developed countries: UN classificationLebanonLesothoLiberiaLibyaLithuaniaLow & middle incomeLow incomeLower middle incomeLuxembourgMacao SAR, ChinaMacedonia, FYRMadagascarMalawiMalaysiaMaliMaltaMarshall IslandsMauritaniaMauritiusMexicoMicronesia, Fed. Sts.Middle East & North AfricaMiddle East & North Africa (excluding high income)Middle East & North Africa (IDA & IBRD countries)Middle incomeMoldovaMongoliaMontenegroMoroccoMozambiqueNamibiaNauruNetherlandsNew CaledoniaNew ZealandNicaraguaNigerNigeriaNorth AmericaNorthern Mariana IslandsNorwayOECD membersOmanOther small statesPacific island small statesPakistanPalauPanamaPapua New GuineaParaguayPeruPhilippinesPolandPortugalPost-demographic dividendPre-demographic dividendQatarRomaniaRussian FederationRwandaSamoaSao Tome and PrincipeSaudi ArabiaSenegalSerbiaSeychellesSierra LeoneSingaporeSint Maarten (Dutch part)Slovak RepublicSloveniaSmall statesSolomon IslandsSouth AfricaSouth AsiaSouth Asia (IDA & IBRD)SpainSri LankaSt. Kitts and NevisSt. LuciaSt. Vincent and the GrenadinesSub-Saharan Africa Sub-Saharan Africa (excluding high income)Sub-Saharan Africa (IDA & IBRD countries)SurinameSwazilandSwedenSwitzerlandSyrian Arab RepublicTajikistanTanzaniaThailandTimor-LesteTogoTongaTrinidad and TobagoTunisiaTurkeyUgandaUkraineUnited Arab EmiratesUnited KingdomUnited StatesUpper middle incomeUruguayVanuatuVenezuela, RBVietnamWest Bank and GazaWorldYemen, Rep.ZambiaZimbabwe Timeline:
This timeline shows a graph from 1976 to 2016 of Kenya. No data until 1975. Number of actual observations by date: 41.
Source name:
World Development Indicators
Source organization:
International Monetary Fund, Balance of Payments database, supplemented by data from the United Nations Conference on Trade and Development and official national sources.
Categories, topics:
Economy & Growth, Financial Sector
Last updated:
apr 23, 2017
Indicators value changes by year
Minimum:
-185.955 mln
jan 1, 2012
Maximum:
217.0 mln
jan 1, 2016
At the date of observation
Value
Absolute change
Change from previous value
jan 1, 1976
1.362 mln
+1.362 mln
0.0%
jan 1, 1977
4.303 mln
+2.941 mln
215.94%
jan 1, 1978
2.658 mln
-1.644 mln
-38.22%
jan 1, 1979
2.329 mln
-329.333K
-12.39%
jan 1, 1980
5.886 mln
+3.557 mln
152.75%
jan 1, 1981
1.078 mln
-4.808 mln
-81.68%
jan 1, 1982
5.858 mln
+4.78 mln
443.34%
jan 1, 1983
9.613 mln
+3.755 mln
64.11%
jan 1, 1984
14.499 mln
+4.885 mln
50.82%
jan 1, 1985
6.868 mln
-7.63 mln
-52.63%
jan 1, 1986
5.416 mln
-1.452 mln
-21.14%
jan 1, 1987
4.93 mln
-485.785K
-8.97%
jan 1, 1988
30.751 mln
+25.821 mln
523.71%
jan 1, 1989
2.198 mln
-28.554 mln
-92.85%
jan 1, 1990
1.361 mln
-836.5K
-38.07%
jan 1, 1991
-442.651K
-1.804 mln
-132.52%
jan 1, 1992
200.0K
+642.651K
-145.18%
jan 1, 1993
-94.982K
-294.982K
-147.49%
jan 1, 1994
2.788 mln
+2.883 mln
-3.04K%
jan 1, 1995
964.401K
-1.824 mln
-65.41%
jan 1, 1996
11.355 mln
+10.391 mln
1.08K%
jan 1, 1997
2.759 mln
-8.596 mln
-75.7%
jan 1, 1998
5.953 mln
+3.194 mln
115.76%
jan 1, 1999
12.124 mln
+6.171 mln
103.66%
jan 1, 2000
24.562 mln
+12.438 mln
102.59%
jan 1, 2001
10.0K
-24.552 mln
-99.96%
jan 1, 2002
10.0K
0.0
0.0%
jan 1, 2003
7.416 mln
+7.406 mln
74.06K%
jan 1, 2004
2.075 mln
-5.341 mln
-72.02%
jan 1, 2005
4.416 mln
+2.341 mln
112.79%
jan 1, 2006
9.687 mln
+5.271 mln
119.36%
jan 1, 2007
23.958 mln
+14.27 mln
147.31%
jan 1, 2008
36.033 mln
+12.075 mln
50.4%
jan 1, 2009
43.767 mln
+7.734 mln
21.46%
jan 1, 2010
45.988 mln
+2.221 mln
5.08%
jan 1, 2011
1.578 mln
-44.41 mln
-96.57%
jan 1, 2012
-185.955 mln
-187.533 mln
-11.89K%
jan 1, 2013
-79.139 mln
+106.816 mln
-57.44%
jan 1, 2014
-136.916 mln
-57.777 mln
73.01%
jan 1, 2015
-78.485 mln
+58.431 mln
-42.68%
jan 1, 2016
217.0 mln
+295.485 mln
-376.48%
Ranking of countries by current statistics by years


Comments: