29
/
en
AIzaSyAYiBZKx7MnpbEhh9jyipgxe19OcubqV5w
April 1, 2024
178843
Liberia
LBR
true
2
1
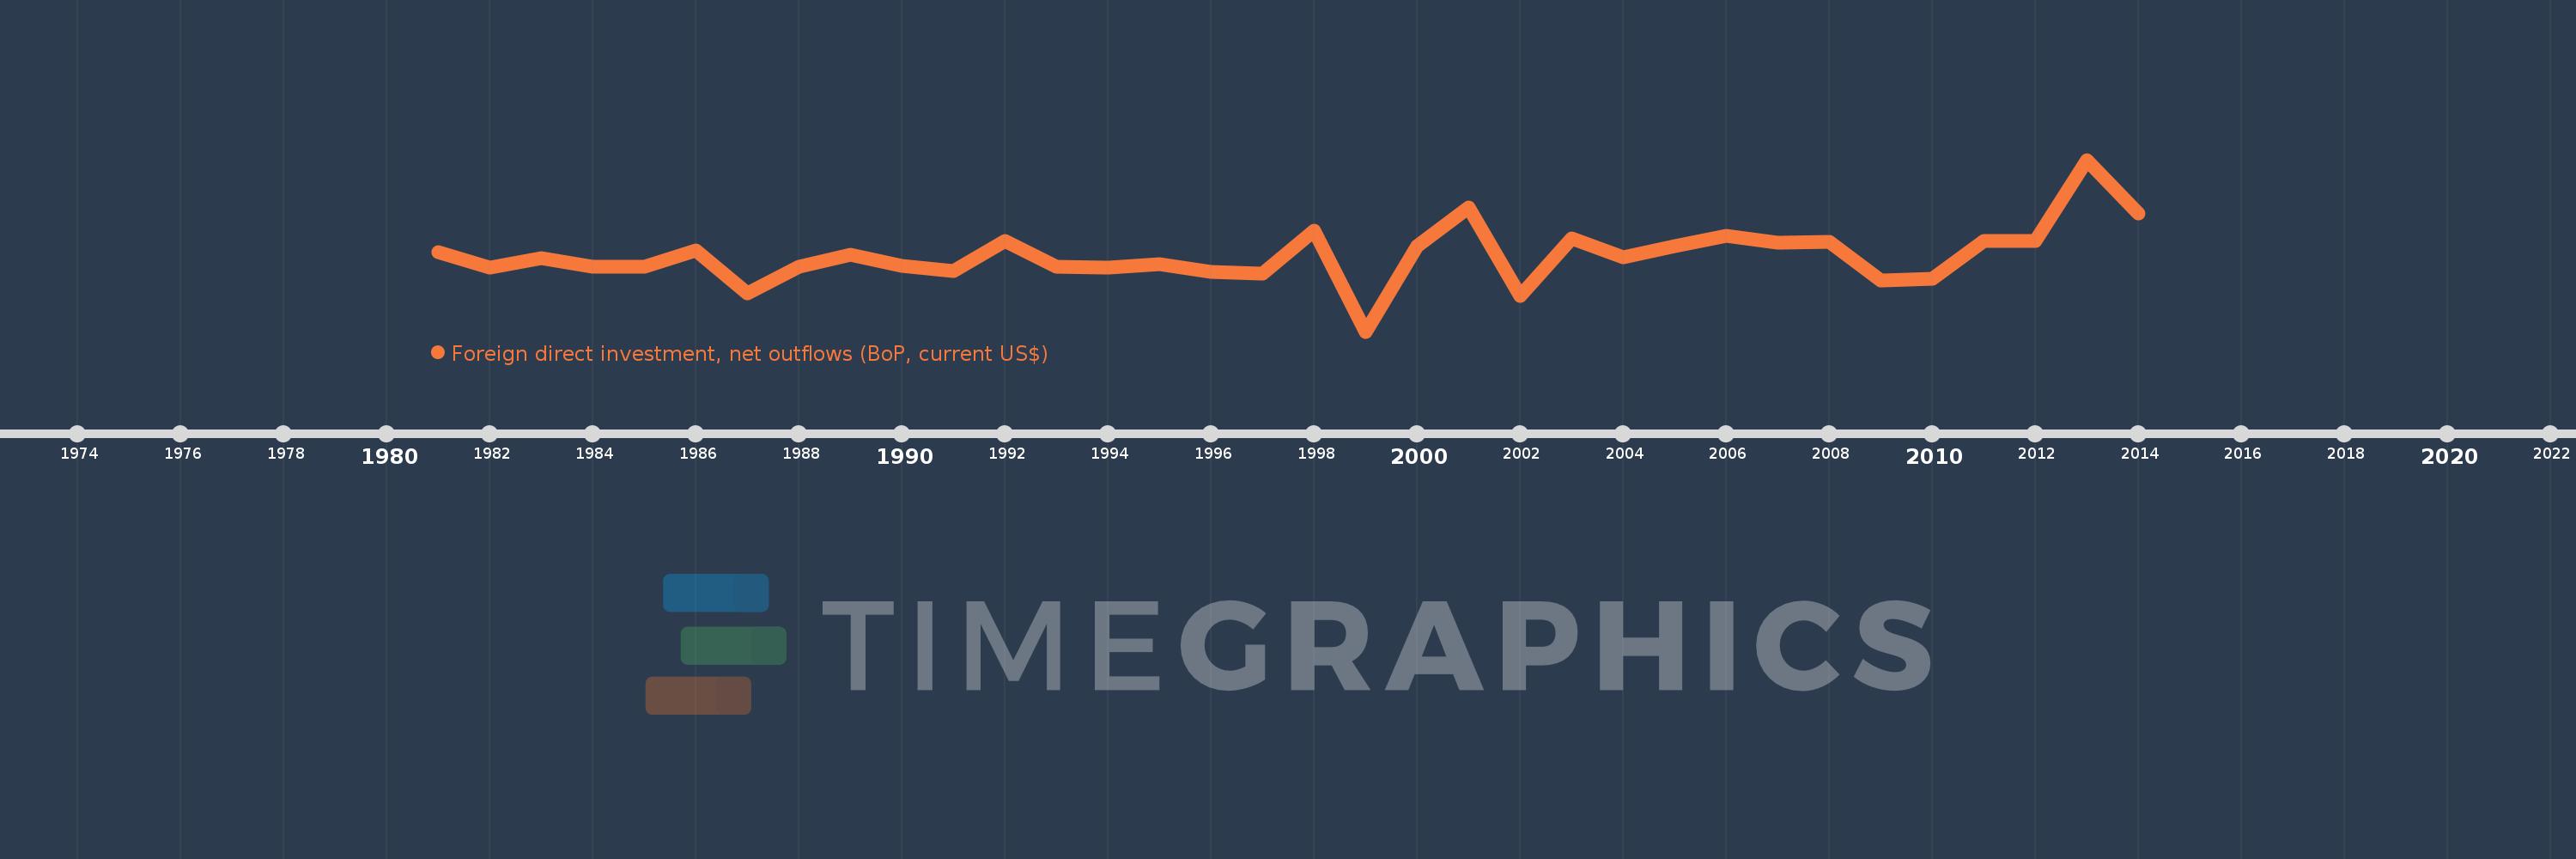
Foreign direct investment, net outflows (BoP, current US$)
2014,2013,2012,2011,2010,2009,2008,2007,2006,2005,2004,2003,2002,2001,2000,1999,1998,1997,1996,1995,1994,1993,1992,1991,1990,1989,1988,1987,1986,1985,1984,1983,1982,1981
This statistics in other country:
AfghanistanAlbaniaAlgeriaAngolaAntigua and BarbudaArab WorldArgentinaArmeniaArubaAustraliaAustriaAzerbaijanBahamas, TheBahrainBangladeshBarbadosBelarusBelgiumBelizeBeninBermudaBoliviaBosnia and HerzegovinaBotswanaBrazilBritish Virgin IslandsBrunei DarussalamBulgariaBurkina FasoBurundiCabo VerdeCambodiaCameroonCanadaCaribbean small statesCayman IslandsCentral African RepublicCentral Europe and the BalticsChadChileChinaColombiaComorosCongo, Dem. Rep.Congo, Rep.Costa RicaCote d'IvoireCroatiaCuracaoCyprusCzech RepublicDenmarkDominicaDominican RepublicEarly-demographic dividendEast Asia & PacificEast Asia & Pacific (excluding high income)East Asia & Pacific (IDA & IBRD countries)EcuadorEgypt, Arab Rep.El SalvadorEquatorial GuineaEritreaEstoniaEuro areaEurope & Central AsiaEurope & Central Asia (excluding high income)Europe & Central Asia (IDA & IBRD countries)European UnionFijiFinlandFragile and conflict affected situationsFranceFrench PolynesiaGabonGambia, TheGeorgiaGermanyGhanaGreeceGrenadaGuatemalaGuineaGuinea-BissauGuyanaHaitiHeavily indebted poor countries (HIPC)High incomeHondurasHong Kong SAR, ChinaHungaryIBRD onlyIcelandIDA & IBRD totalIDA blendIDA onlyIDA totalIndiaIndonesiaIran, Islamic Rep.IraqIrelandIsraelItalyJamaicaJapanJordanKazakhstanKenyaKiribatiKorea, Dem. People’s Rep.Korea, Rep.KosovoKuwaitKyrgyz RepublicLao PDRLate-demographic dividendLatin America & Caribbean Latin America & Caribbean (excluding high income)Latin America & the Caribbean (IDA & IBRD countries)LatviaLeast developed countries: UN classificationLebanonLesothoLiberiaLibyaLithuaniaLow & middle incomeLow incomeLower middle incomeLuxembourgMacao SAR, ChinaMacedonia, FYRMadagascarMalawiMalaysiaMaliMaltaMarshall IslandsMauritaniaMauritiusMexicoMicronesia, Fed. Sts.Middle East & North AfricaMiddle East & North Africa (excluding high income)Middle East & North Africa (IDA & IBRD countries)Middle incomeMoldovaMongoliaMontenegroMoroccoMozambiqueNamibiaNauruNetherlandsNew CaledoniaNew ZealandNicaraguaNigerNigeriaNorth AmericaNorthern Mariana IslandsNorwayOECD membersOmanOther small statesPacific island small statesPakistanPalauPanamaPapua New GuineaParaguayPeruPhilippinesPolandPortugalPost-demographic dividendPre-demographic dividendQatarRomaniaRussian FederationRwandaSamoaSao Tome and PrincipeSaudi ArabiaSenegalSerbiaSeychellesSierra LeoneSingaporeSint Maarten (Dutch part)Slovak RepublicSloveniaSmall statesSolomon IslandsSouth AfricaSouth AsiaSouth Asia (IDA & IBRD)SpainSri LankaSt. Kitts and NevisSt. LuciaSt. Vincent and the GrenadinesSub-Saharan Africa Sub-Saharan Africa (excluding high income)Sub-Saharan Africa (IDA & IBRD countries)SurinameSwazilandSwedenSwitzerlandSyrian Arab RepublicTajikistanTanzaniaThailandTimor-LesteTogoTongaTrinidad and TobagoTunisiaTurkeyUgandaUkraineUnited Arab EmiratesUnited KingdomUnited StatesUpper middle incomeUruguayVanuatuVenezuela, RBVietnamWest Bank and GazaWorldYemen, Rep.ZambiaZimbabwe Timeline:
This timeline shows a graph from 1981 to 2014 of Liberia. No data until 1980. Number of actual observations by date: 34.
Source name:
World Development Indicators
Source organization:
International Monetary Fund, Balance of Payments database, supplemented by data from the United Nations Conference on Trade and Development and official national sources.
Categories, topics:
Economy & Growth, Financial Sector
Last updated:
apr 23, 2017
Indicators value changes by year
Minimum:
-729.355 mln
jan 1, 1999
Maximum:
1.354 bln
jan 1, 2013
At the date of observation
Value
Absolute change
Change from previous value
jan 1, 1981
236.128 mln
+236.128 mln
0.0%
jan 1, 1982
41.92 mln
-194.208 mln
-82.25%
jan 1, 1983
161.21 mln
+119.29 mln
284.57%
jan 1, 1984
60.968 mln
-100.242 mln
-62.18%
jan 1, 1985
59.465 mln
-1.503 mln
-2.47%
jan 1, 1986
254.998 mln
+195.533 mln
328.82%
jan 1, 1987
-267.33 mln
-522.328 mln
-204.84%
jan 1, 1988
60.737 mln
+328.067 mln
-122.72%
jan 1, 1989
202.241 mln
+141.504 mln
232.98%
jan 1, 1990
64.552 mln
-137.689 mln
-68.08%
jan 1, 1991
5.941 mln
-58.611 mln
-90.8%
jan 1, 1992
366.352 mln
+360.411 mln
6.07K%
jan 1, 1993
58.544 mln
-307.808 mln
-84.02%
jan 1, 1994
50.942 mln
-7.602 mln
-12.99%
jan 1, 1995
91.301 mln
+40.359 mln
79.23%
jan 1, 1996
-9.703 mln
-101.004 mln
-110.63%
jan 1, 1997
-24.449 mln
-14.746 mln
151.97%
jan 1, 1998
495.127 mln
+519.576 mln
-2.13K%
jan 1, 1999
-729.355 mln
-1.224 bln
-247.31%
jan 1, 2000
310.603 mln
+1.04 bln
-142.59%
jan 1, 2001
779.897 mln
+469.293 mln
151.09%
jan 1, 2002
-292.028 mln
-1.072 bln
-137.44%
jan 1, 2003
402.937 mln
+694.965 mln
-237.98%
jan 1, 2004
172.979 mln
-229.958 mln
-57.07%
jan 1, 2005
304.496 mln
+131.517 mln
76.03%
jan 1, 2006
436.844 mln
+132.348 mln
43.46%
jan 1, 2007
346.392 mln
-90.451 mln
-20.71%
jan 1, 2008
362.577 mln
+16.185 mln
4.67%
jan 1, 2009
-111.0 mln
-473.577 mln
-130.61%
jan 1, 2010
-90.0 mln
+21.0 mln
-18.92%
jan 1, 2011
369.384 mln
+459.384 mln
-510.43%
jan 1, 2012
371.7 mln
+2.316 mln
0.63%
jan 1, 2013
1.354 bln
+982.4 mln
264.3%
jan 1, 2014
698.395 mln
-655.705 mln
-48.42%
Ranking of countries by current statistics by years


Comments: