29
/
en
AIzaSyAYiBZKx7MnpbEhh9jyipgxe19OcubqV5w
April 1, 2024
50897
Middle income
MIC
false
2
1
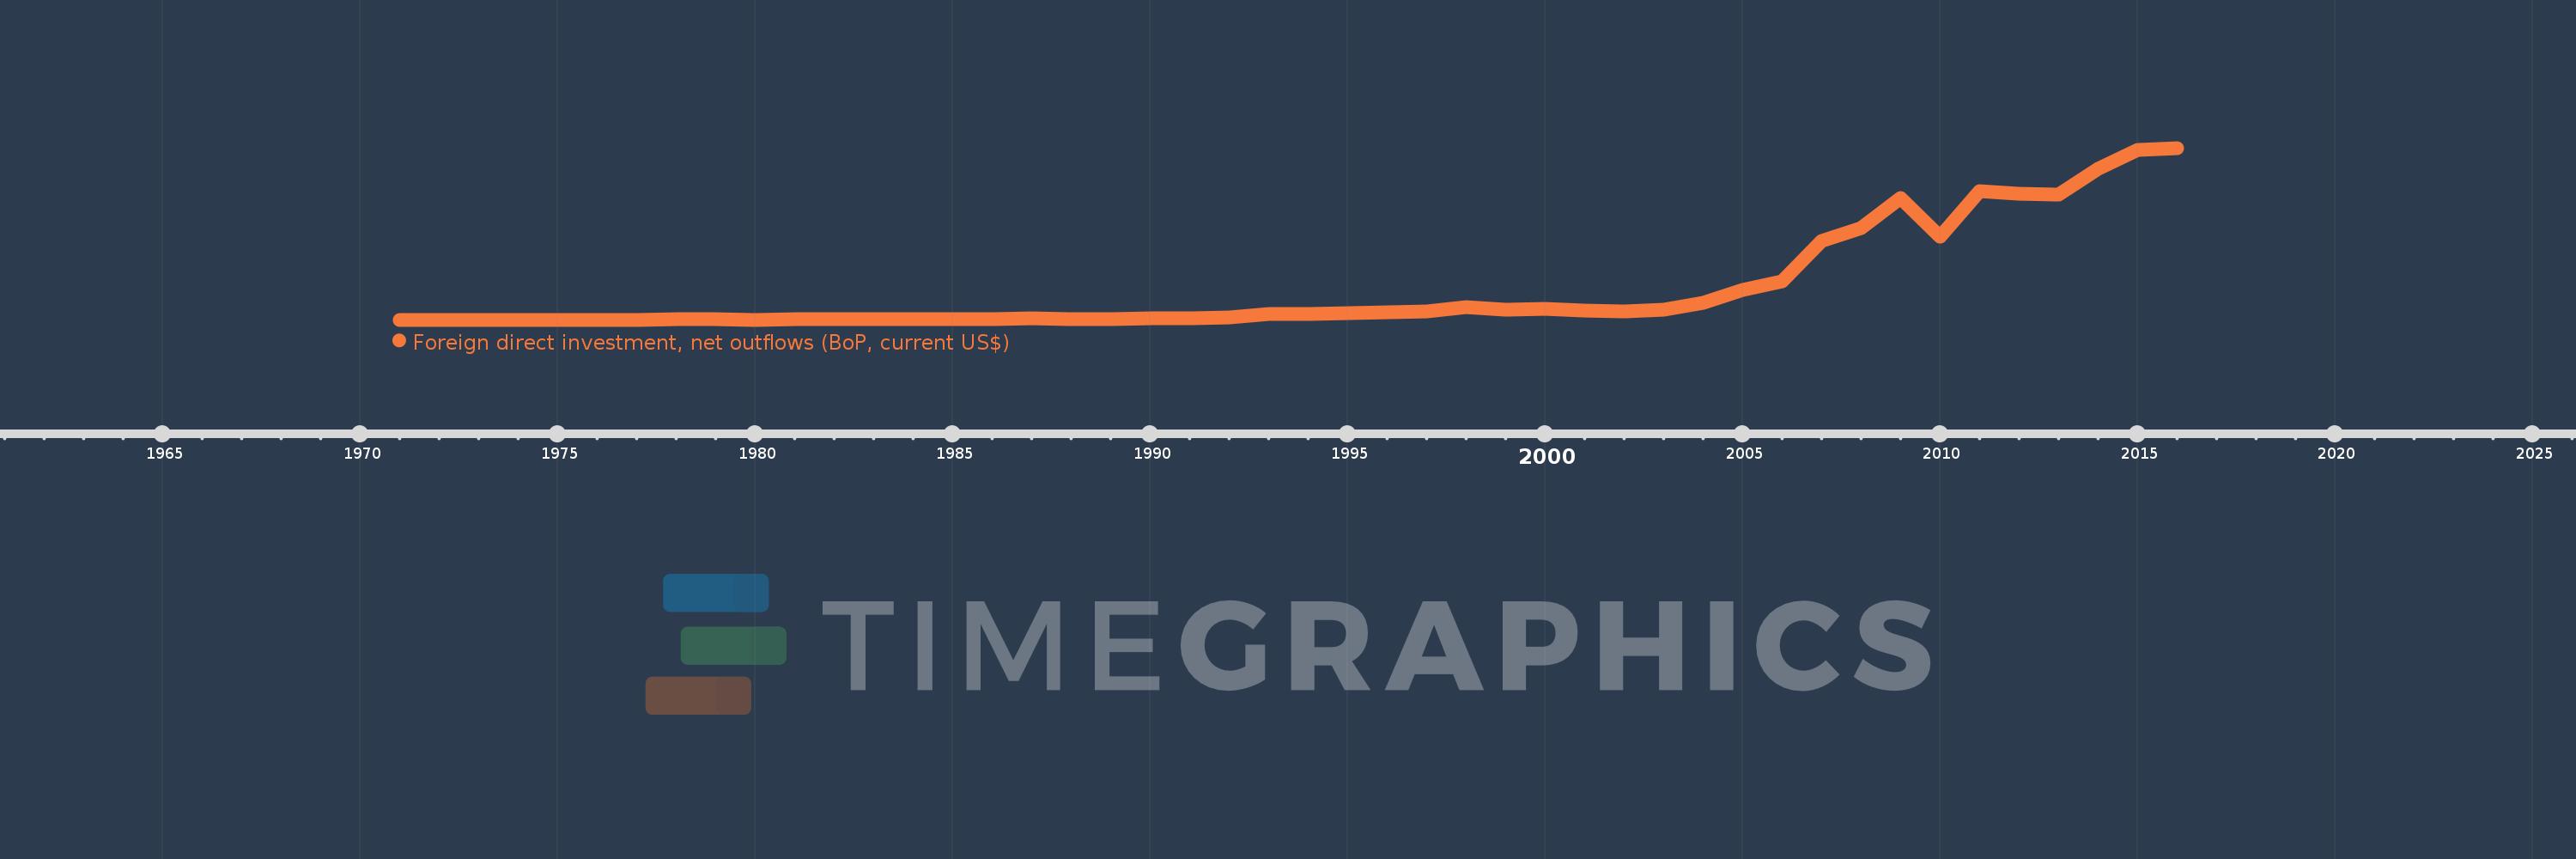
Foreign direct investment, net outflows (BoP, current US$)
2016,2015,2014,2013,2012,2011,2010,2009,2008,2007,2006,2005,2004,2003,2002,2001,2000,1999,1998,1997,1996,1995,1994,1993,1992,1991,1990,1989,1988,1987,1986,1985,1984,1983,1982,1981,1980,1979,1978,1977,1976,1975,1974,1973,1972,1971
This statistics in other country:
AfghanistanAlbaniaAlgeriaAngolaAntigua and BarbudaArab WorldArgentinaArmeniaArubaAustraliaAustriaAzerbaijanBahamas, TheBahrainBangladeshBarbadosBelarusBelgiumBelizeBeninBermudaBoliviaBosnia and HerzegovinaBotswanaBrazilBritish Virgin IslandsBrunei DarussalamBulgariaBurkina FasoBurundiCabo VerdeCambodiaCameroonCanadaCaribbean small statesCayman IslandsCentral African RepublicCentral Europe and the BalticsChadChileChinaColombiaComorosCongo, Dem. Rep.Congo, Rep.Costa RicaCote d'IvoireCroatiaCuracaoCyprusCzech RepublicDenmarkDominicaDominican RepublicEarly-demographic dividendEast Asia & PacificEast Asia & Pacific (excluding high income)East Asia & Pacific (IDA & IBRD countries)EcuadorEgypt, Arab Rep.El SalvadorEquatorial GuineaEritreaEstoniaEuro areaEurope & Central AsiaEurope & Central Asia (excluding high income)Europe & Central Asia (IDA & IBRD countries)European UnionFijiFinlandFragile and conflict affected situationsFranceFrench PolynesiaGabonGambia, TheGeorgiaGermanyGhanaGreeceGrenadaGuatemalaGuineaGuinea-BissauGuyanaHaitiHeavily indebted poor countries (HIPC)High incomeHondurasHong Kong SAR, ChinaHungaryIBRD onlyIcelandIDA & IBRD totalIDA blendIDA onlyIDA totalIndiaIndonesiaIran, Islamic Rep.IraqIrelandIsraelItalyJamaicaJapanJordanKazakhstanKenyaKiribatiKorea, Dem. People’s Rep.Korea, Rep.KosovoKuwaitKyrgyz RepublicLao PDRLate-demographic dividendLatin America & Caribbean Latin America & Caribbean (excluding high income)Latin America & the Caribbean (IDA & IBRD countries)LatviaLeast developed countries: UN classificationLebanonLesothoLiberiaLibyaLithuaniaLow & middle incomeLow incomeLower middle incomeLuxembourgMacao SAR, ChinaMacedonia, FYRMadagascarMalawiMalaysiaMaliMaltaMarshall IslandsMauritaniaMauritiusMexicoMicronesia, Fed. Sts.Middle East & North AfricaMiddle East & North Africa (excluding high income)Middle East & North Africa (IDA & IBRD countries)Middle incomeMoldovaMongoliaMontenegroMoroccoMozambiqueNamibiaNauruNetherlandsNew CaledoniaNew ZealandNicaraguaNigerNigeriaNorth AmericaNorthern Mariana IslandsNorwayOECD membersOmanOther small statesPacific island small statesPakistanPalauPanamaPapua New GuineaParaguayPeruPhilippinesPolandPortugalPost-demographic dividendPre-demographic dividendQatarRomaniaRussian FederationRwandaSamoaSao Tome and PrincipeSaudi ArabiaSenegalSerbiaSeychellesSierra LeoneSingaporeSint Maarten (Dutch part)Slovak RepublicSloveniaSmall statesSolomon IslandsSouth AfricaSouth AsiaSouth Asia (IDA & IBRD)SpainSri LankaSt. Kitts and NevisSt. LuciaSt. Vincent and the GrenadinesSub-Saharan Africa Sub-Saharan Africa (excluding high income)Sub-Saharan Africa (IDA & IBRD countries)SurinameSwazilandSwedenSwitzerlandSyrian Arab RepublicTajikistanTanzaniaThailandTimor-LesteTogoTongaTrinidad and TobagoTunisiaTurkeyUgandaUkraineUnited Arab EmiratesUnited KingdomUnited StatesUpper middle incomeUruguayVanuatuVenezuela, RBVietnamWest Bank and GazaWorldYemen, Rep.ZambiaZimbabwe Timeline:
This timeline shows a graph from 1971 to 2016 of Middle income. No data until 1970. Number of actual observations by date: 46.
Source name:
World Development Indicators
Source organization:
International Monetary Fund, Balance of Payments database, supplemented by data from the United Nations Conference on Trade and Development and official national sources.
Categories, topics:
Economy & Growth, Financial Sector
Last updated:
apr 23, 2017
Indicators value changes by year
Minimum:
33.371 mln
jan 1, 1972
Maximum:
307.464 bln
jan 1, 2016
At the date of observation
Value
Absolute change
Change from previous value
jan 1, 1971
39.617 mln
+39.617 mln
0.0%
jan 1, 1972
33.371 mln
-6.246 mln
-15.77%
jan 1, 1973
47.952 mln
+14.581 mln
43.7%
jan 1, 1974
96.648 mln
+48.696 mln
101.55%
jan 1, 1975
191.423 mln
+94.775 mln
98.06%
jan 1, 1976
297.858 mln
+106.435 mln
55.6%
jan 1, 1977
306.536 mln
+8.678 mln
2.91%
jan 1, 1978
386.428 mln
+79.892 mln
26.06%
jan 1, 1979
488.591 mln
+102.163 mln
26.44%
jan 1, 1980
268.724 mln
-219.867 mln
-45.0%
jan 1, 1981
1.603 bln
+1.335 bln
496.67%
jan 1, 1982
1.226 bln
-377.438 mln
-23.54%
jan 1, 1983
878.689 mln
-347.259 mln
-28.33%
jan 1, 1984
925.477 mln
+46.788 mln
5.32%
jan 1, 1985
1.058 bln
+132.833 mln
14.35%
jan 1, 1986
1.367 bln
+308.852 mln
29.18%
jan 1, 1987
1.912 bln
+544.418 mln
39.82%
jan 1, 1988
1.805 bln
-106.624 mln
-5.58%
jan 1, 1989
1.823 bln
+18.178 mln
1.01%
jan 1, 1990
3.227 bln
+1.403 bln
76.98%
jan 1, 1991
3.099 bln
-127.9 mln
-3.96%
jan 1, 1992
3.782 bln
+683.005 mln
22.04%
jan 1, 1993
10.489 bln
+6.707 bln
177.35%
jan 1, 1994
9.998 bln
-490.856 mln
-4.68%
jan 1, 1995
11.454 bln
+1.456 bln
14.57%
jan 1, 1996
13.443 bln
+1.989 bln
17.36%
jan 1, 1997
14.417 bln
+974.491 mln
7.25%
jan 1, 1998
22.021 bln
+7.604 bln
52.74%
jan 1, 1999
18.618 bln
-3.403 bln
-15.45%
jan 1, 2000
19.32 bln
+702.461 mln
3.77%
jan 1, 2001
15.73 bln
-3.591 bln
-18.59%
jan 1, 2002
15.264 bln
-465.941 mln
-2.96%
jan 1, 2003
18.762 bln
+3.498 bln
22.92%
jan 1, 2004
30.672 bln
+11.91 bln
63.48%
jan 1, 2005
53.325 bln
+22.654 bln
73.86%
jan 1, 2006
68.514 bln
+15.188 bln
28.48%
jan 1, 2007
140.302 bln
+71.788 bln
104.78%
jan 1, 2008
164.688 bln
+24.386 bln
17.38%
jan 1, 2009
217.367 bln
+52.679 bln
31.99%
jan 1, 2010
149.444 bln
-67.923 bln
-31.25%
jan 1, 2011
229.731 bln
+80.287 bln
53.72%
jan 1, 2012
225.177 bln
-4.554 bln
-1.98%
jan 1, 2013
223.76 bln
-1.417 bln
-0.63%
jan 1, 2014
269.58 bln
+45.82 bln
20.48%
jan 1, 2015
303.454 bln
+33.874 bln
12.57%
jan 1, 2016
307.464 bln
+4.011 bln
1.32%
Ranking of countries by current statistics by years


Comments: