29
/
en
AIzaSyAYiBZKx7MnpbEhh9jyipgxe19OcubqV5w
April 1, 2024
38144
IDA blend
IDB
false
2
1
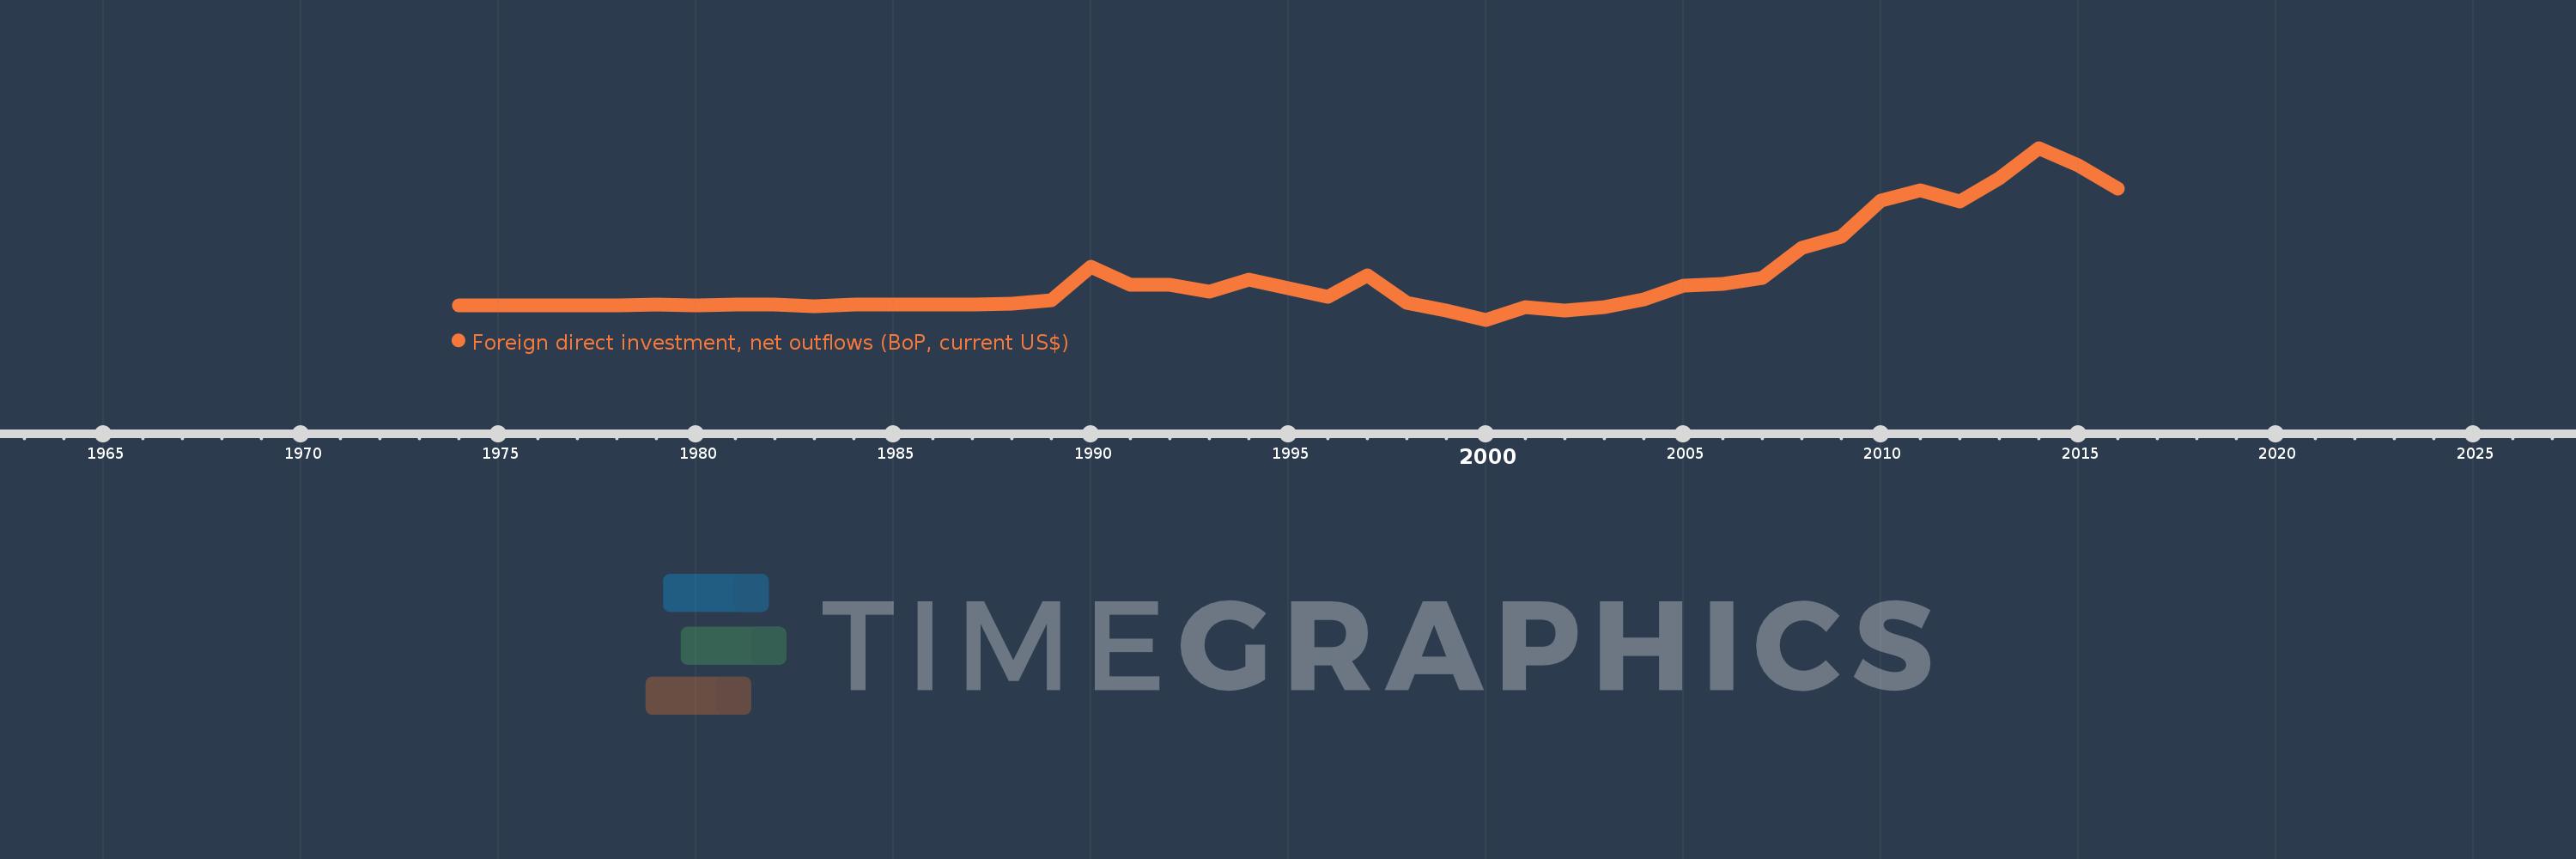
Foreign direct investment, net outflows (BoP, current US$)
2016,2015,2014,2013,2012,2011,2010,2009,2008,2007,2006,2005,2004,2003,2002,2001,2000,1999,1998,1997,1996,1995,1994,1993,1992,1991,1990,1989,1988,1987,1986,1985,1984,1983,1982,1981,1980,1979,1978,1977,1976,1975,1974
This statistics in other country:
AfghanistanAlbaniaAlgeriaAngolaAntigua and BarbudaArab WorldArgentinaArmeniaArubaAustraliaAustriaAzerbaijanBahamas, TheBahrainBangladeshBarbadosBelarusBelgiumBelizeBeninBermudaBoliviaBosnia and HerzegovinaBotswanaBrazilBritish Virgin IslandsBrunei DarussalamBulgariaBurkina FasoBurundiCabo VerdeCambodiaCameroonCanadaCaribbean small statesCayman IslandsCentral African RepublicCentral Europe and the BalticsChadChileChinaColombiaComorosCongo, Dem. Rep.Congo, Rep.Costa RicaCote d'IvoireCroatiaCuracaoCyprusCzech RepublicDenmarkDominicaDominican RepublicEarly-demographic dividendEast Asia & PacificEast Asia & Pacific (excluding high income)East Asia & Pacific (IDA & IBRD countries)EcuadorEgypt, Arab Rep.El SalvadorEquatorial GuineaEritreaEstoniaEuro areaEurope & Central AsiaEurope & Central Asia (excluding high income)Europe & Central Asia (IDA & IBRD countries)European UnionFijiFinlandFragile and conflict affected situationsFranceFrench PolynesiaGabonGambia, TheGeorgiaGermanyGhanaGreeceGrenadaGuatemalaGuineaGuinea-BissauGuyanaHaitiHeavily indebted poor countries (HIPC)High incomeHondurasHong Kong SAR, ChinaHungaryIBRD onlyIcelandIDA & IBRD totalIDA blendIDA onlyIDA totalIndiaIndonesiaIran, Islamic Rep.IraqIrelandIsraelItalyJamaicaJapanJordanKazakhstanKenyaKiribatiKorea, Dem. People’s Rep.Korea, Rep.KosovoKuwaitKyrgyz RepublicLao PDRLate-demographic dividendLatin America & Caribbean Latin America & Caribbean (excluding high income)Latin America & the Caribbean (IDA & IBRD countries)LatviaLeast developed countries: UN classificationLebanonLesothoLiberiaLibyaLithuaniaLow & middle incomeLow incomeLower middle incomeLuxembourgMacao SAR, ChinaMacedonia, FYRMadagascarMalawiMalaysiaMaliMaltaMarshall IslandsMauritaniaMauritiusMexicoMicronesia, Fed. Sts.Middle East & North AfricaMiddle East & North Africa (excluding high income)Middle East & North Africa (IDA & IBRD countries)Middle incomeMoldovaMongoliaMontenegroMoroccoMozambiqueNamibiaNauruNetherlandsNew CaledoniaNew ZealandNicaraguaNigerNigeriaNorth AmericaNorthern Mariana IslandsNorwayOECD membersOmanOther small statesPacific island small statesPakistanPalauPanamaPapua New GuineaParaguayPeruPhilippinesPolandPortugalPost-demographic dividendPre-demographic dividendQatarRomaniaRussian FederationRwandaSamoaSao Tome and PrincipeSaudi ArabiaSenegalSerbiaSeychellesSierra LeoneSingaporeSint Maarten (Dutch part)Slovak RepublicSloveniaSmall statesSolomon IslandsSouth AfricaSouth AsiaSouth Asia (IDA & IBRD)SpainSri LankaSt. Kitts and NevisSt. LuciaSt. Vincent and the GrenadinesSub-Saharan Africa Sub-Saharan Africa (excluding high income)Sub-Saharan Africa (IDA & IBRD countries)SurinameSwazilandSwedenSwitzerlandSyrian Arab RepublicTajikistanTanzaniaThailandTimor-LesteTogoTongaTrinidad and TobagoTunisiaTurkeyUgandaUkraineUnited Arab EmiratesUnited KingdomUnited StatesUpper middle incomeUruguayVanuatuVenezuela, RBVietnamWest Bank and GazaWorldYemen, Rep.ZambiaZimbabwe Timeline:
This timeline shows a graph from 1974 to 2016 of IDA blend. No data until 1973. Number of actual observations by date: 43.
Source name:
World Development Indicators
Source organization:
International Monetary Fund, Balance of Payments database, supplemented by data from the United Nations Conference on Trade and Development and official national sources.
Categories, topics:
Economy & Growth, Financial Sector
Last updated:
apr 23, 2017
Indicators value changes by year
Minimum:
-316.74 mln
jan 1, 2000
Maximum:
3.463 bln
jan 1, 2014
At the date of observation
Value
Absolute change
Change from previous value
jan 1, 1974
4.0 mln
+4.0 mln
0.0%
jan 1, 1975
8.0 mln
+4.0 mln
100.0%
jan 1, 1976
2.0 mln
-6.0 mln
-75.0%
jan 1, 1977
6.116 mln
+4.116 mln
205.78%
jan 1, 1978
6.169 mln
+53.226K
0.87%
jan 1, 1979
11.731 mln
+5.562 mln
90.17%
jan 1, 1980
6.032 mln
-5.699 mln
-48.58%
jan 1, 1981
12.553 mln
+6.521 mln
108.1%
jan 1, 1982
10.988 mln
-1.564 mln
-12.46%
jan 1, 1983
-17.842 mln
-28.83 mln
-262.37%
jan 1, 1984
17.45 mln
+35.292 mln
-197.81%
jan 1, 1985
14.866 mln
-2.584 mln
-14.81%
jan 1, 1986
9.924 mln
-4.942 mln
-33.25%
jan 1, 1987
21.726 mln
+11.802 mln
118.92%
jan 1, 1988
33.568 mln
+11.842 mln
54.51%
jan 1, 1989
107.568 mln
+74.001 mln
220.45%
jan 1, 1990
852.435 mln
+744.867 mln
692.46%
jan 1, 1991
455.003 mln
-397.432 mln
-46.62%
jan 1, 1992
453.335 mln
-1.667 mln
-0.37%
jan 1, 1993
294.058 mln
-159.278 mln
-35.13%
jan 1, 1994
570.147 mln
+276.089 mln
93.89%
jan 1, 1995
367.964 mln
-202.183 mln
-35.46%
jan 1, 1996
178.708 mln
-189.256 mln
-51.43%
jan 1, 1997
664.005 mln
+485.297 mln
271.56%
jan 1, 1998
57.001 mln
-607.004 mln
-91.42%
jan 1, 1999
-116.4 mln
-173.401 mln
-304.21%
jan 1, 2000
-316.74 mln
-200.34 mln
172.11%
jan 1, 2001
-46.257 mln
+270.483 mln
-85.4%
jan 1, 2002
-118.893 mln
-72.636 mln
157.03%
jan 1, 2003
-31.052 mln
+87.841 mln
-73.88%
jan 1, 2004
126.321 mln
+157.372 mln
-506.8%
jan 1, 2005
428.886 mln
+302.565 mln
239.52%
jan 1, 2006
469.321 mln
+40.436 mln
9.43%
jan 1, 2007
608.5 mln
+139.178 mln
29.66%
jan 1, 2008
1.272 bln
+663.423 mln
109.03%
jan 1, 2009
1.519 bln
+246.822 mln
19.41%
jan 1, 2010
2.313 bln
+794.468 mln
52.31%
jan 1, 2011
2.525 bln
+212.128 mln
9.17%
jan 1, 2012
2.288 bln
-237.498 mln
-9.4%
jan 1, 2013
2.801 bln
+512.775 mln
22.41%
jan 1, 2014
3.463 bln
+661.92 mln
23.63%
jan 1, 2015
3.087 bln
-375.825 mln
-10.85%
jan 1, 2016
2.571 bln
-515.992 mln
-16.72%
Ranking of countries by current statistics by years


Comments: