29
/
en
AIzaSyAYiBZKx7MnpbEhh9jyipgxe19OcubqV5w
April 1, 2024
141792
Greece
GRC
true
2
1
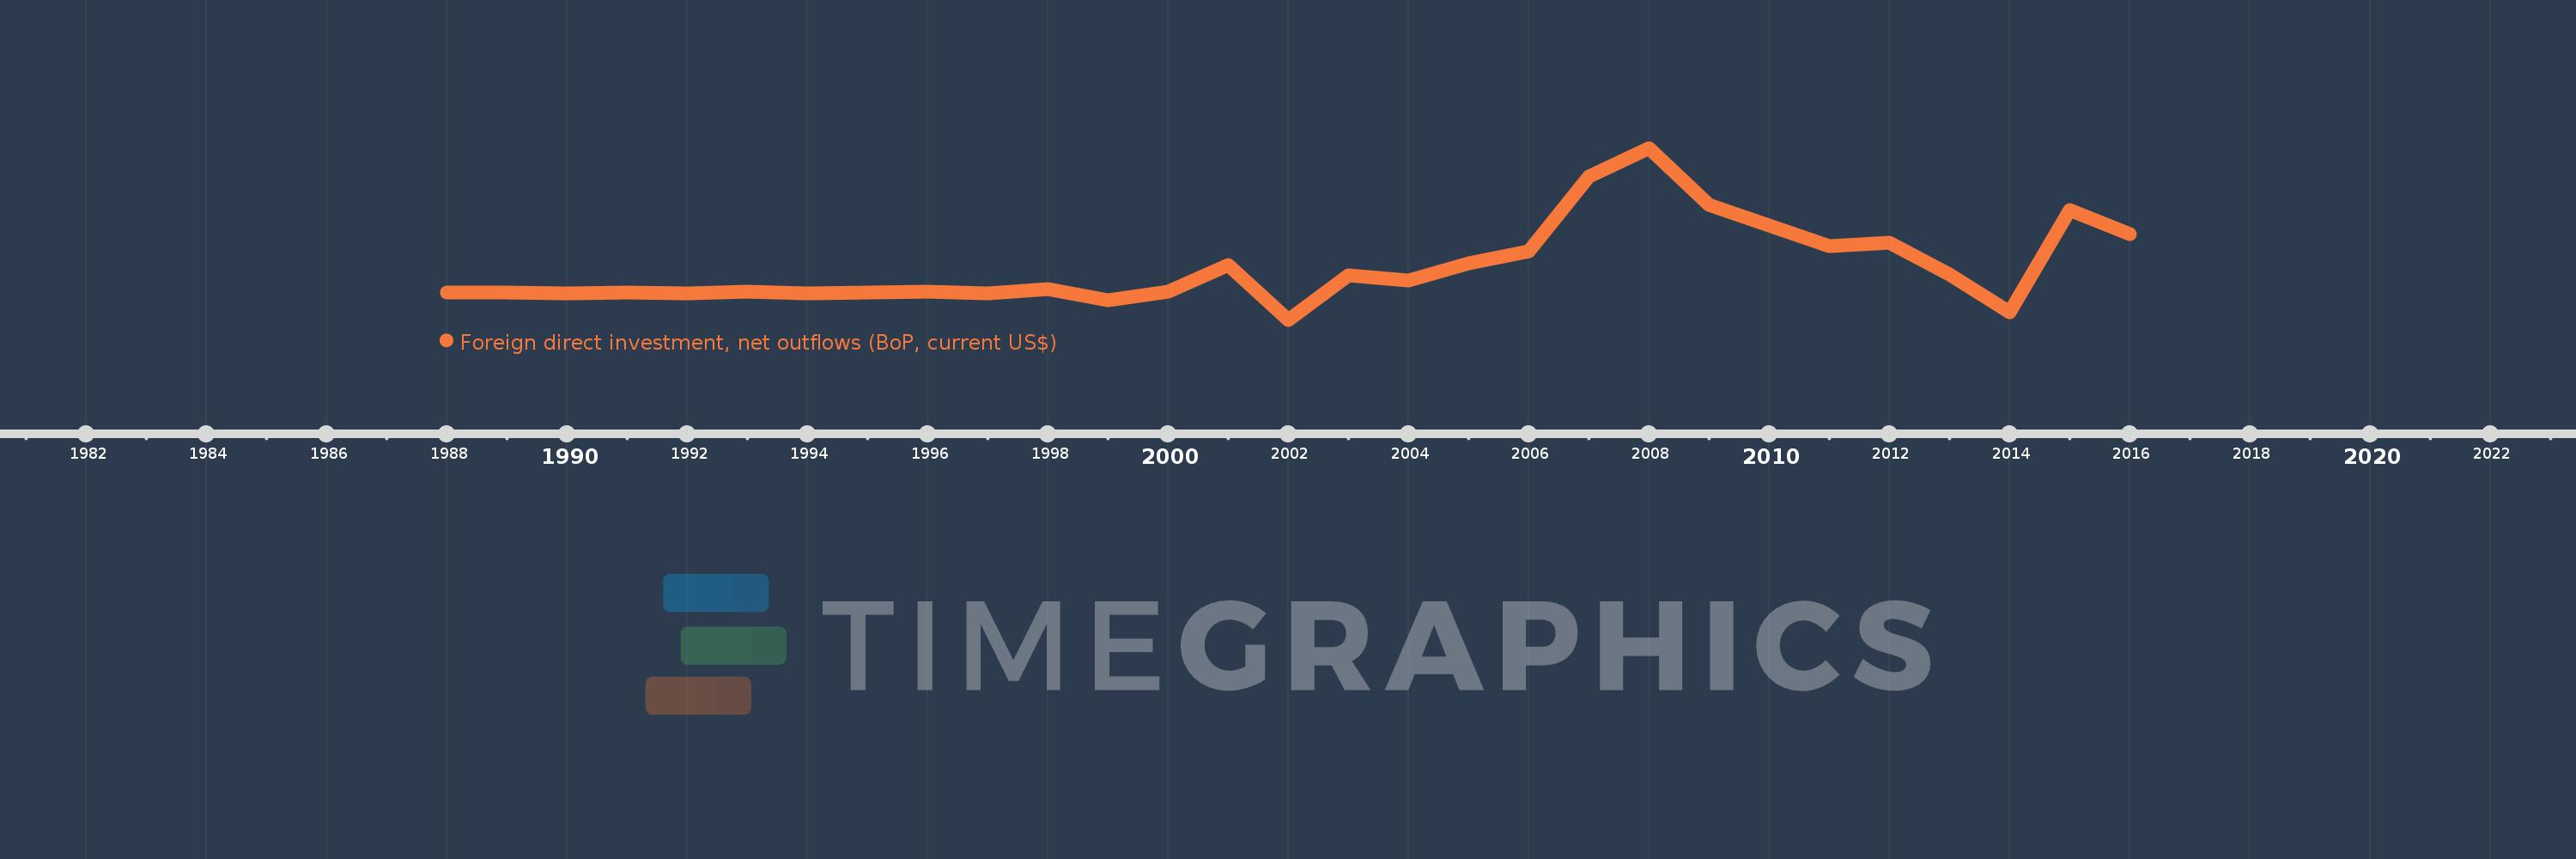
Foreign direct investment, net outflows (BoP, current US$)
2016,2015,2014,2013,2012,2011,2010,2009,2008,2007,2006,2005,2004,2003,2002,2001,2000,1999,1998,1997,1996,1995,1994,1993,1992,1991,1990,1989,1988
This statistics in other country:
AfghanistanAlbaniaAlgeriaAngolaAntigua and BarbudaArab WorldArgentinaArmeniaArubaAustraliaAustriaAzerbaijanBahamas, TheBahrainBangladeshBarbadosBelarusBelgiumBelizeBeninBermudaBoliviaBosnia and HerzegovinaBotswanaBrazilBritish Virgin IslandsBrunei DarussalamBulgariaBurkina FasoBurundiCabo VerdeCambodiaCameroonCanadaCaribbean small statesCayman IslandsCentral African RepublicCentral Europe and the BalticsChadChileChinaColombiaComorosCongo, Dem. Rep.Congo, Rep.Costa RicaCote d'IvoireCroatiaCuracaoCyprusCzech RepublicDenmarkDominicaDominican RepublicEarly-demographic dividendEast Asia & PacificEast Asia & Pacific (excluding high income)East Asia & Pacific (IDA & IBRD countries)EcuadorEgypt, Arab Rep.El SalvadorEquatorial GuineaEritreaEstoniaEuro areaEurope & Central AsiaEurope & Central Asia (excluding high income)Europe & Central Asia (IDA & IBRD countries)European UnionFijiFinlandFragile and conflict affected situationsFranceFrench PolynesiaGabonGambia, TheGeorgiaGermanyGhanaGreeceGrenadaGuatemalaGuineaGuinea-BissauGuyanaHaitiHeavily indebted poor countries (HIPC)High incomeHondurasHong Kong SAR, ChinaHungaryIBRD onlyIcelandIDA & IBRD totalIDA blendIDA onlyIDA totalIndiaIndonesiaIran, Islamic Rep.IraqIrelandIsraelItalyJamaicaJapanJordanKazakhstanKenyaKiribatiKorea, Dem. People’s Rep.Korea, Rep.KosovoKuwaitKyrgyz RepublicLao PDRLate-demographic dividendLatin America & Caribbean Latin America & Caribbean (excluding high income)Latin America & the Caribbean (IDA & IBRD countries)LatviaLeast developed countries: UN classificationLebanonLesothoLiberiaLibyaLithuaniaLow & middle incomeLow incomeLower middle incomeLuxembourgMacao SAR, ChinaMacedonia, FYRMadagascarMalawiMalaysiaMaliMaltaMarshall IslandsMauritaniaMauritiusMexicoMicronesia, Fed. Sts.Middle East & North AfricaMiddle East & North Africa (excluding high income)Middle East & North Africa (IDA & IBRD countries)Middle incomeMoldovaMongoliaMontenegroMoroccoMozambiqueNamibiaNauruNetherlandsNew CaledoniaNew ZealandNicaraguaNigerNigeriaNorth AmericaNorthern Mariana IslandsNorwayOECD membersOmanOther small statesPacific island small statesPakistanPalauPanamaPapua New GuineaParaguayPeruPhilippinesPolandPortugalPost-demographic dividendPre-demographic dividendQatarRomaniaRussian FederationRwandaSamoaSao Tome and PrincipeSaudi ArabiaSenegalSerbiaSeychellesSierra LeoneSingaporeSint Maarten (Dutch part)Slovak RepublicSloveniaSmall statesSolomon IslandsSouth AfricaSouth AsiaSouth Asia (IDA & IBRD)SpainSri LankaSt. Kitts and NevisSt. LuciaSt. Vincent and the GrenadinesSub-Saharan Africa Sub-Saharan Africa (excluding high income)Sub-Saharan Africa (IDA & IBRD countries)SurinameSwazilandSwedenSwitzerlandSyrian Arab RepublicTajikistanTanzaniaThailandTimor-LesteTogoTongaTrinidad and TobagoTunisiaTurkeyUgandaUkraineUnited Arab EmiratesUnited KingdomUnited StatesUpper middle incomeUruguayVanuatuVenezuela, RBVietnamWest Bank and GazaWorldYemen, Rep.ZambiaZimbabwe Timeline:
This timeline shows a graph from 1988 to 2016 of Greece. No data until 1987. Number of actual observations by date: 29.
Source name:
World Development Indicators
Source organization:
International Monetary Fund, Balance of Payments database, supplemented by data from the United Nations Conference on Trade and Development and official national sources.
Categories, topics:
Economy & Growth, Financial Sector
Last updated:
apr 23, 2017
Indicators value changes by year
Minimum:
-972.0 mln
jan 1, 2002
Maximum:
5.261 bln
jan 1, 2008
At the date of observation
Value
Absolute change
Change from previous value
jan 1, 1988
10.336 mln
+10.336 mln
0.0%
jan 1, 1989
17.198 mln
+6.861 mln
66.38%
jan 1, 1990
-13.118 mln
-30.316 mln
-176.28%
jan 1, 1991
10.706 mln
+23.824 mln
-181.61%
jan 1, 1992
-25.741 mln
-36.447 mln
-340.44%
jan 1, 1993
46.498 mln
+72.239 mln
-280.64%
jan 1, 1994
-22.432 mln
-68.93 mln
-148.24%
jan 1, 1995
15.786 mln
+38.218 mln
-170.37%
jan 1, 1996
41.595 mln
+25.809 mln
163.49%
jan 1, 1997
-25.368 mln
-66.963 mln
-160.99%
jan 1, 1998
155.663 mln
+181.031 mln
-713.62%
jan 1, 1999
-275.6 mln
-431.263 mln
-277.05%
jan 1, 2000
57.7 mln
+333.3 mln
-120.94%
jan 1, 2001
1.007 bln
+949.2 mln
1.65K%
jan 1, 2002
-972.0 mln
-1.979 bln
-196.53%
jan 1, 2003
648.94 mln
+1.621 bln
-166.76%
jan 1, 2004
450.941 mln
-197.999 mln
-30.51%
jan 1, 2005
1.071 bln
+619.654 mln
137.41%
jan 1, 2006
1.508 bln
+437.715 mln
40.89%
jan 1, 2007
4.234 bln
+2.726 bln
180.73%
jan 1, 2008
5.261 bln
+1.027 bln
24.24%
jan 1, 2009
3.206 bln
-2.055 bln
-39.06%
jan 1, 2010
2.44 bln
-766.136 mln
-23.9%
jan 1, 2011
1.697 bln
-742.987 mln
-30.45%
jan 1, 2012
1.817 bln
+120.51 mln
7.1%
jan 1, 2013
678.464 mln
-1.139 bln
-62.67%
jan 1, 2014
-697.765 mln
-1.376 bln
-202.84%
jan 1, 2015
3.015 bln
+3.713 bln
-532.14%
jan 1, 2016
2.132 bln
-883.699 mln
-29.31%
Ranking of countries by current statistics by years


Comments: