29
/
en
AIzaSyAYiBZKx7MnpbEhh9jyipgxe19OcubqV5w
April 1, 2024
26501
Early-demographic dividend
EAR
false
2
1
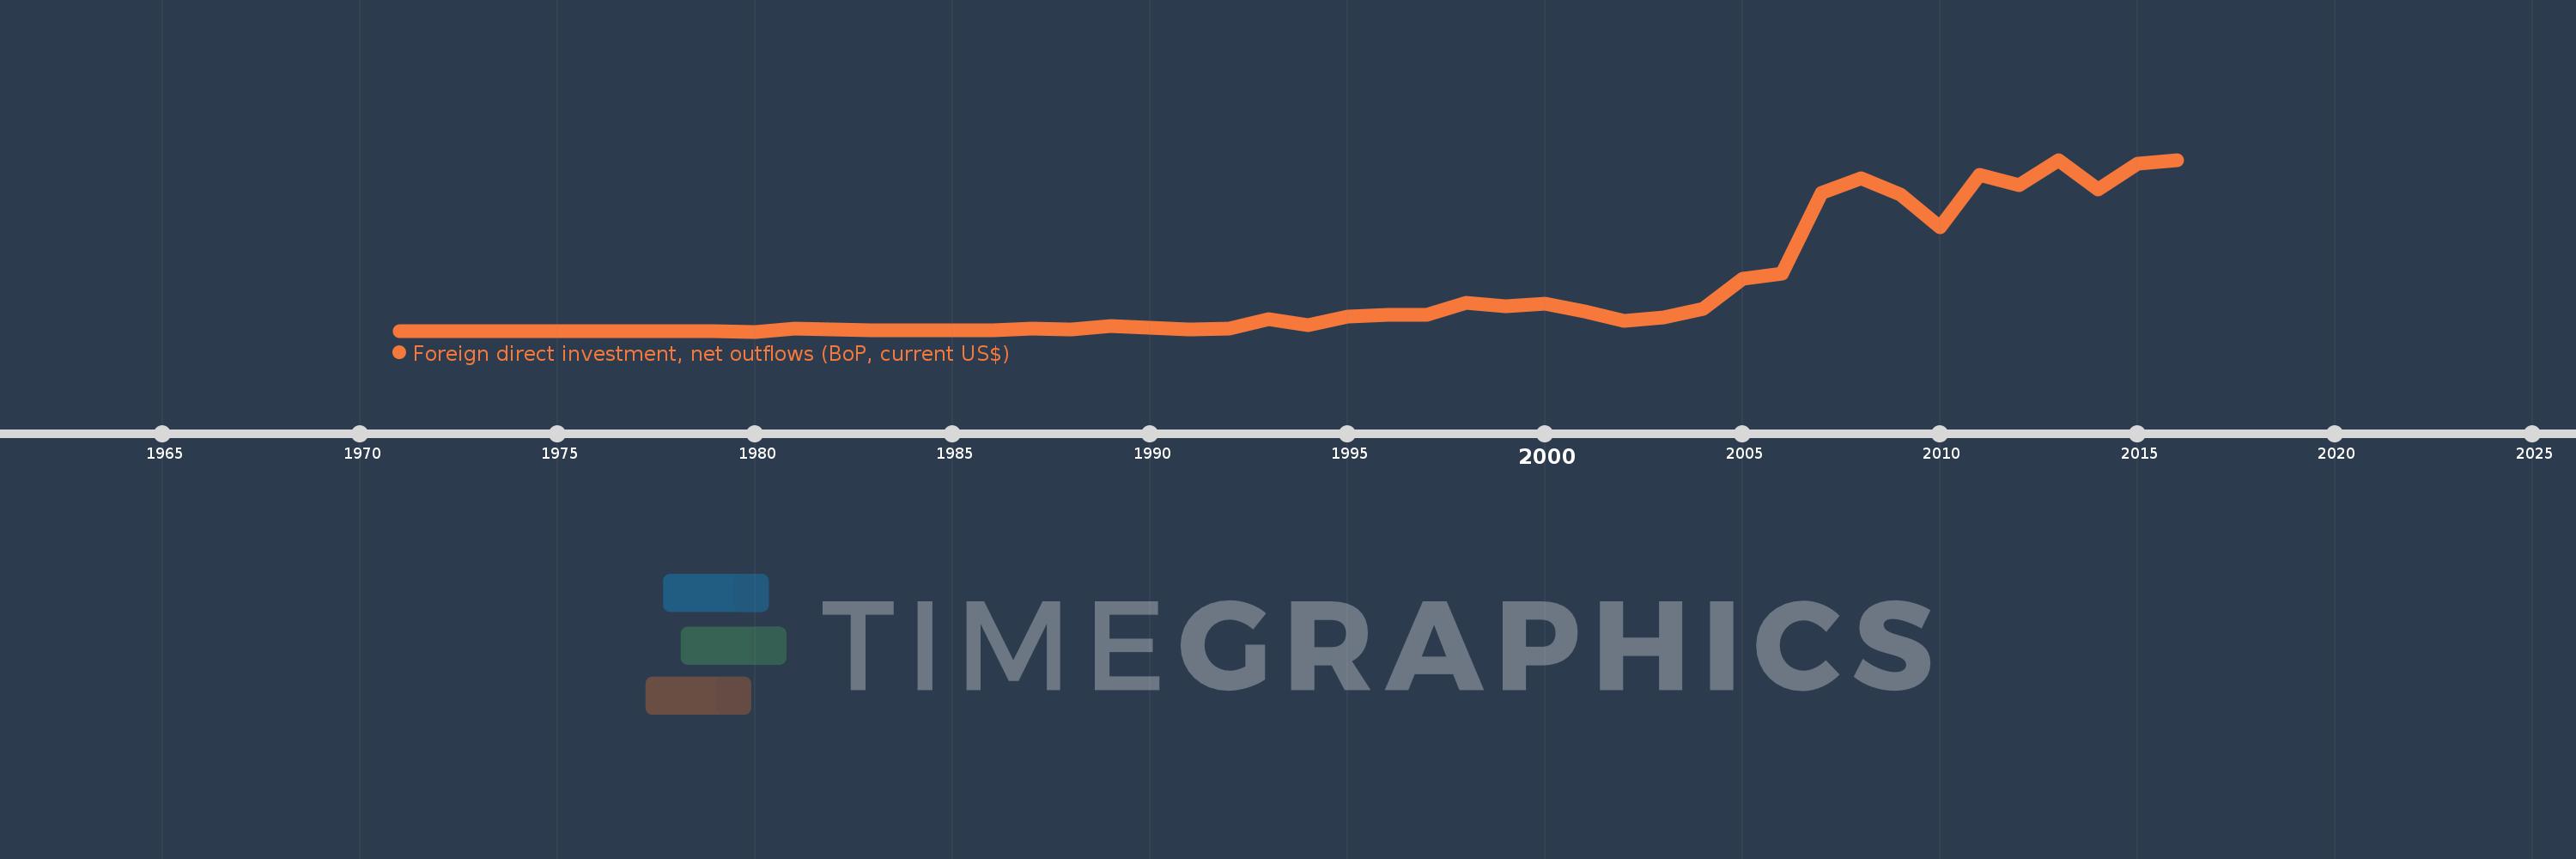
Foreign direct investment, net outflows (BoP, current US$)
2016,2015,2014,2013,2012,2011,2010,2009,2008,2007,2006,2005,2004,2003,2002,2001,2000,1999,1998,1997,1996,1995,1994,1993,1992,1991,1990,1989,1988,1987,1986,1985,1984,1983,1982,1981,1980,1979,1978,1977,1976,1975,1974,1973,1972,1971
This statistics in other country:
AfghanistanAlbaniaAlgeriaAngolaAntigua and BarbudaArab WorldArgentinaArmeniaArubaAustraliaAustriaAzerbaijanBahamas, TheBahrainBangladeshBarbadosBelarusBelgiumBelizeBeninBermudaBoliviaBosnia and HerzegovinaBotswanaBrazilBritish Virgin IslandsBrunei DarussalamBulgariaBurkina FasoBurundiCabo VerdeCambodiaCameroonCanadaCaribbean small statesCayman IslandsCentral African RepublicCentral Europe and the BalticsChadChileChinaColombiaComorosCongo, Dem. Rep.Congo, Rep.Costa RicaCote d'IvoireCroatiaCuracaoCyprusCzech RepublicDenmarkDominicaDominican RepublicEarly-demographic dividendEast Asia & PacificEast Asia & Pacific (excluding high income)East Asia & Pacific (IDA & IBRD countries)EcuadorEgypt, Arab Rep.El SalvadorEquatorial GuineaEritreaEstoniaEuro areaEurope & Central AsiaEurope & Central Asia (excluding high income)Europe & Central Asia (IDA & IBRD countries)European UnionFijiFinlandFragile and conflict affected situationsFranceFrench PolynesiaGabonGambia, TheGeorgiaGermanyGhanaGreeceGrenadaGuatemalaGuineaGuinea-BissauGuyanaHaitiHeavily indebted poor countries (HIPC)High incomeHondurasHong Kong SAR, ChinaHungaryIBRD onlyIcelandIDA & IBRD totalIDA blendIDA onlyIDA totalIndiaIndonesiaIran, Islamic Rep.IraqIrelandIsraelItalyJamaicaJapanJordanKazakhstanKenyaKiribatiKorea, Dem. People’s Rep.Korea, Rep.KosovoKuwaitKyrgyz RepublicLao PDRLate-demographic dividendLatin America & Caribbean Latin America & Caribbean (excluding high income)Latin America & the Caribbean (IDA & IBRD countries)LatviaLeast developed countries: UN classificationLebanonLesothoLiberiaLibyaLithuaniaLow & middle incomeLow incomeLower middle incomeLuxembourgMacao SAR, ChinaMacedonia, FYRMadagascarMalawiMalaysiaMaliMaltaMarshall IslandsMauritaniaMauritiusMexicoMicronesia, Fed. Sts.Middle East & North AfricaMiddle East & North Africa (excluding high income)Middle East & North Africa (IDA & IBRD countries)Middle incomeMoldovaMongoliaMontenegroMoroccoMozambiqueNamibiaNauruNetherlandsNew CaledoniaNew ZealandNicaraguaNigerNigeriaNorth AmericaNorthern Mariana IslandsNorwayOECD membersOmanOther small statesPacific island small statesPakistanPalauPanamaPapua New GuineaParaguayPeruPhilippinesPolandPortugalPost-demographic dividendPre-demographic dividendQatarRomaniaRussian FederationRwandaSamoaSao Tome and PrincipeSaudi ArabiaSenegalSerbiaSeychellesSierra LeoneSingaporeSint Maarten (Dutch part)Slovak RepublicSloveniaSmall statesSolomon IslandsSouth AfricaSouth AsiaSouth Asia (IDA & IBRD)SpainSri LankaSt. Kitts and NevisSt. LuciaSt. Vincent and the GrenadinesSub-Saharan Africa Sub-Saharan Africa (excluding high income)Sub-Saharan Africa (IDA & IBRD countries)SurinameSwazilandSwedenSwitzerlandSyrian Arab RepublicTajikistanTanzaniaThailandTimor-LesteTogoTongaTrinidad and TobagoTunisiaTurkeyUgandaUkraineUnited Arab EmiratesUnited KingdomUnited StatesUpper middle incomeUruguayVanuatuVenezuela, RBVietnamWest Bank and GazaWorldYemen, Rep.ZambiaZimbabwe Timeline:
This timeline shows a graph from 1971 to 2016 of Early-demographic dividend. No data until 1970. Number of actual observations by date: 46.
Source name:
World Development Indicators
Source organization:
International Monetary Fund, Balance of Payments database, supplemented by data from the United Nations Conference on Trade and Development and official national sources.
Categories, topics:
Economy & Growth, Financial Sector
Last updated:
apr 23, 2017
Indicators value changes by year
Minimum:
7.233 mln
jan 1, 1980
Maximum:
66.761 bln
jan 1, 2013
At the date of observation
Value
Absolute change
Change from previous value
jan 1, 1971
29.617 mln
+29.617 mln
0.0%
jan 1, 1972
34.362 mln
+4.745 mln
16.02%
jan 1, 1973
26.866 mln
-7.495 mln
-21.81%
jan 1, 1974
59.356 mln
+32.49 mln
120.93%
jan 1, 1975
118.61 mln
+59.254 mln
99.83%
jan 1, 1976
176.496 mln
+57.886 mln
48.8%
jan 1, 1977
107.683 mln
-68.814 mln
-38.99%
jan 1, 1978
169.025 mln
+61.342 mln
56.97%
jan 1, 1979
280.54 mln
+111.515 mln
65.98%
jan 1, 1980
7.233 mln
-273.308 mln
-97.42%
jan 1, 1981
1.129 bln
+1.122 bln
15.51K%
jan 1, 1982
807.16 mln
-321.773 mln
-28.5%
jan 1, 1983
634.329 mln
-172.831 mln
-21.41%
jan 1, 1984
357.519 mln
-276.81 mln
-43.64%
jan 1, 1985
671.102 mln
+313.583 mln
87.71%
jan 1, 1986
525.554 mln
-145.548 mln
-21.69%
jan 1, 1987
1.242 bln
+716.136 mln
136.26%
jan 1, 1988
750.23 mln
-491.46 mln
-39.58%
jan 1, 1989
2.214 bln
+1.464 bln
195.12%
jan 1, 1990
1.509 bln
-704.983 mln
-31.84%
jan 1, 1991
811.135 mln
-697.961 mln
-46.25%
jan 1, 1992
1.27 bln
+458.755 mln
56.56%
jan 1, 1993
4.901 bln
+3.631 bln
285.94%
jan 1, 1994
2.575 bln
-2.327 bln
-47.47%
jan 1, 1995
5.943 bln
+3.368 bln
130.83%
jan 1, 1996
6.578 bln
+634.992 mln
10.69%
jan 1, 1997
6.358 bln
-219.287 mln
-3.33%
jan 1, 1998
11.149 bln
+4.79 bln
75.34%
jan 1, 1999
9.846 bln
-1.303 bln
-11.69%
jan 1, 2000
10.947 bln
+1.101 bln
11.18%
jan 1, 2001
7.755 bln
-3.191 bln
-29.15%
jan 1, 2002
4.142 bln
-3.614 bln
-46.6%
jan 1, 2003
5.36 bln
+1.219 bln
29.43%
jan 1, 2004
8.906 bln
+3.546 bln
66.15%
jan 1, 2005
20.501 bln
+11.595 bln
130.19%
jan 1, 2006
22.609 bln
+2.108 bln
10.28%
jan 1, 2007
53.992 bln
+31.383 bln
138.81%
jan 1, 2008
59.437 bln
+5.445 bln
10.08%
jan 1, 2009
53.225 bln
-6.212 bln
-10.45%
jan 1, 2010
40.477 bln
-12.747 bln
-23.95%
jan 1, 2011
60.966 bln
+20.488 bln
50.62%
jan 1, 2012
56.988 bln
-3.977 bln
-6.52%
jan 1, 2013
66.761 bln
+9.773 bln
17.15%
jan 1, 2014
55.256 bln
-11.505 bln
-17.23%
jan 1, 2015
65.125 bln
+9.869 bln
17.86%
jan 1, 2016
66.619 bln
+1.494 bln
2.29%
Ranking of countries by current statistics by years


Comments: