29
/
en
AIzaSyAYiBZKx7MnpbEhh9jyipgxe19OcubqV5w
April 1, 2024
43415
Latin America & the Caribbean (IDA & IBRD countries)
TLA
false
2
1
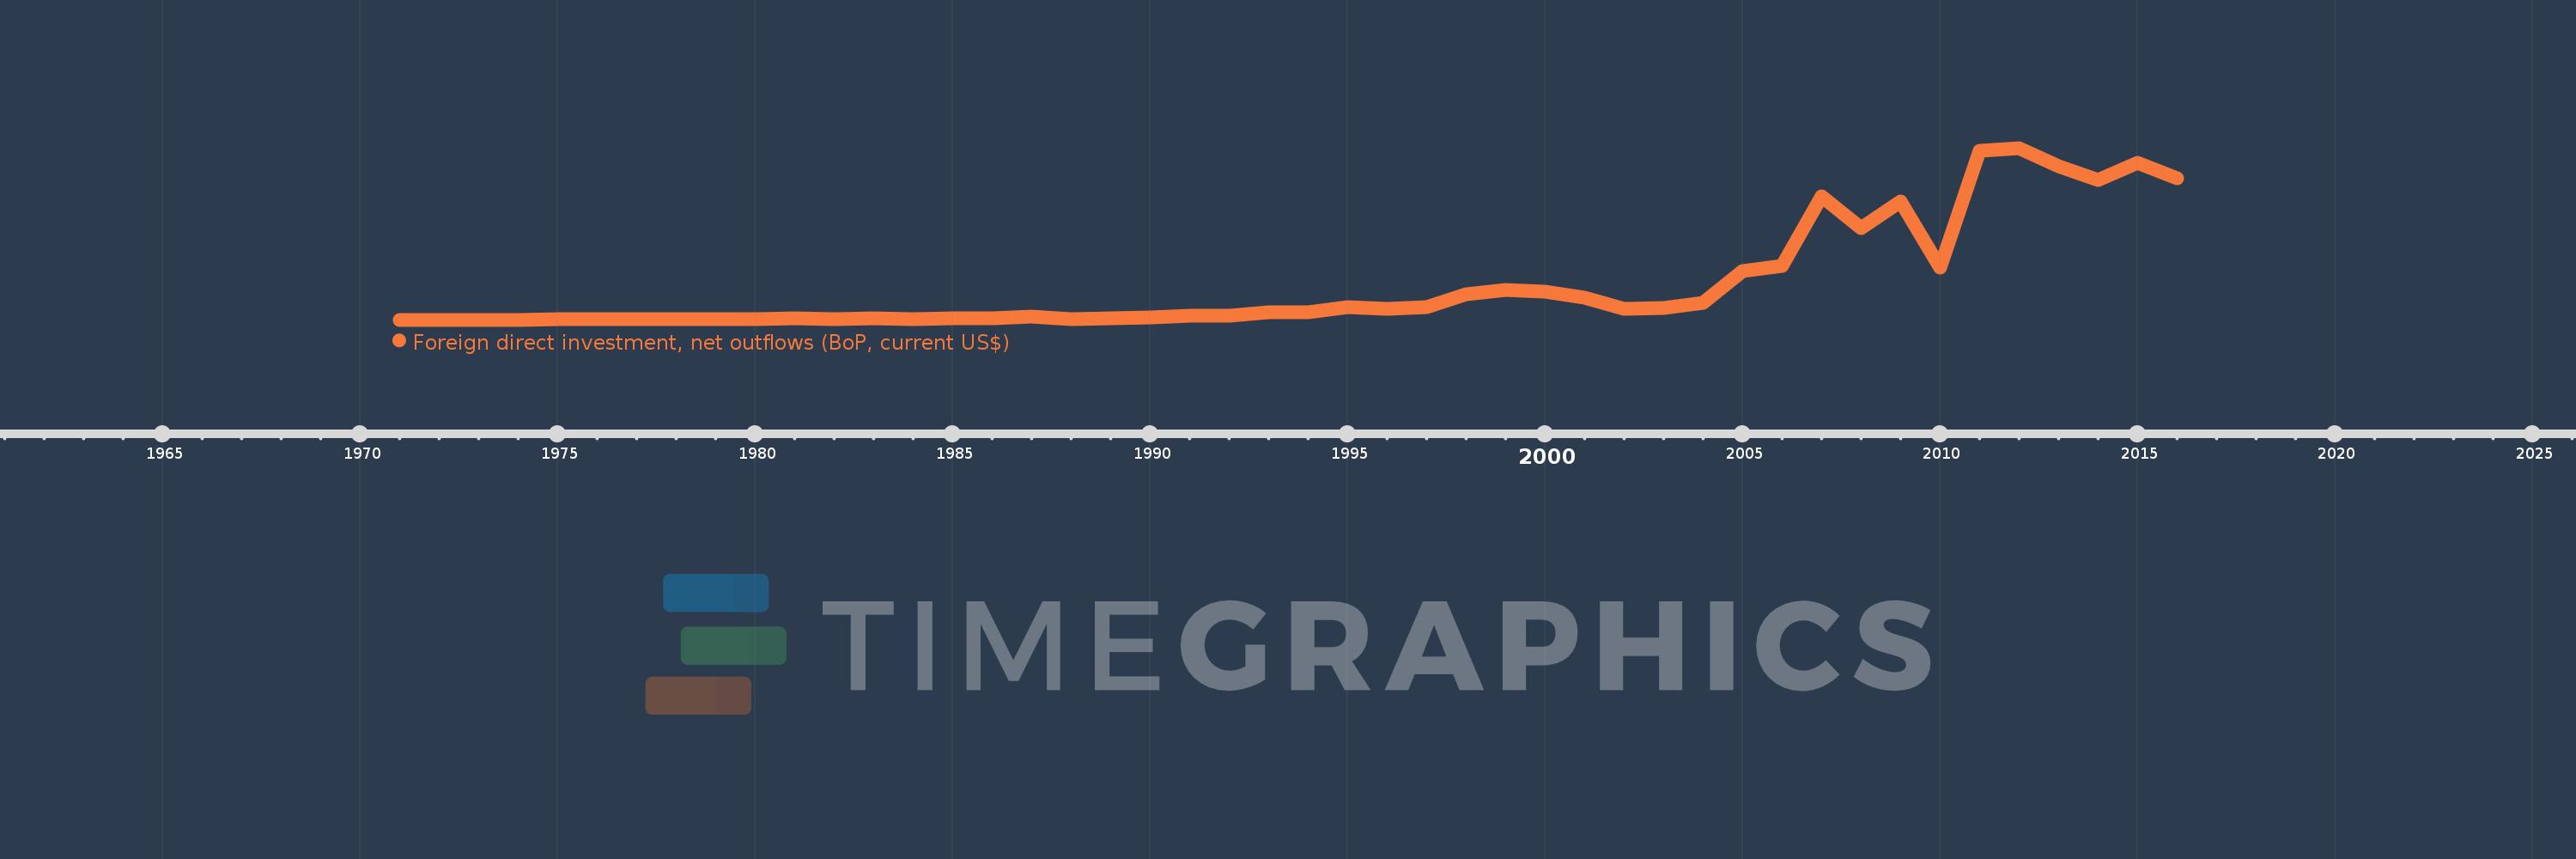
Foreign direct investment, net outflows (BoP, current US$)
2016,2015,2014,2013,2012,2011,2010,2009,2008,2007,2006,2005,2004,2003,2002,2001,2000,1999,1998,1997,1996,1995,1994,1993,1992,1991,1990,1989,1988,1987,1986,1985,1984,1983,1982,1981,1980,1979,1978,1977,1976,1975,1974,1973,1972,1971
This statistics in other country:
AfghanistanAlbaniaAlgeriaAngolaAntigua and BarbudaArab WorldArgentinaArmeniaArubaAustraliaAustriaAzerbaijanBahamas, TheBahrainBangladeshBarbadosBelarusBelgiumBelizeBeninBermudaBoliviaBosnia and HerzegovinaBotswanaBrazilBritish Virgin IslandsBrunei DarussalamBulgariaBurkina FasoBurundiCabo VerdeCambodiaCameroonCanadaCaribbean small statesCayman IslandsCentral African RepublicCentral Europe and the BalticsChadChileChinaColombiaComorosCongo, Dem. Rep.Congo, Rep.Costa RicaCote d'IvoireCroatiaCuracaoCyprusCzech RepublicDenmarkDominicaDominican RepublicEarly-demographic dividendEast Asia & PacificEast Asia & Pacific (excluding high income)East Asia & Pacific (IDA & IBRD countries)EcuadorEgypt, Arab Rep.El SalvadorEquatorial GuineaEritreaEstoniaEuro areaEurope & Central AsiaEurope & Central Asia (excluding high income)Europe & Central Asia (IDA & IBRD countries)European UnionFijiFinlandFragile and conflict affected situationsFranceFrench PolynesiaGabonGambia, TheGeorgiaGermanyGhanaGreeceGrenadaGuatemalaGuineaGuinea-BissauGuyanaHaitiHeavily indebted poor countries (HIPC)High incomeHondurasHong Kong SAR, ChinaHungaryIBRD onlyIcelandIDA & IBRD totalIDA blendIDA onlyIDA totalIndiaIndonesiaIran, Islamic Rep.IraqIrelandIsraelItalyJamaicaJapanJordanKazakhstanKenyaKiribatiKorea, Dem. People’s Rep.Korea, Rep.KosovoKuwaitKyrgyz RepublicLao PDRLate-demographic dividendLatin America & Caribbean Latin America & Caribbean (excluding high income)Latin America & the Caribbean (IDA & IBRD countries)LatviaLeast developed countries: UN classificationLebanonLesothoLiberiaLibyaLithuaniaLow & middle incomeLow incomeLower middle incomeLuxembourgMacao SAR, ChinaMacedonia, FYRMadagascarMalawiMalaysiaMaliMaltaMarshall IslandsMauritaniaMauritiusMexicoMicronesia, Fed. Sts.Middle East & North AfricaMiddle East & North Africa (excluding high income)Middle East & North Africa (IDA & IBRD countries)Middle incomeMoldovaMongoliaMontenegroMoroccoMozambiqueNamibiaNauruNetherlandsNew CaledoniaNew ZealandNicaraguaNigerNigeriaNorth AmericaNorthern Mariana IslandsNorwayOECD membersOmanOther small statesPacific island small statesPakistanPalauPanamaPapua New GuineaParaguayPeruPhilippinesPolandPortugalPost-demographic dividendPre-demographic dividendQatarRomaniaRussian FederationRwandaSamoaSao Tome and PrincipeSaudi ArabiaSenegalSerbiaSeychellesSierra LeoneSingaporeSint Maarten (Dutch part)Slovak RepublicSloveniaSmall statesSolomon IslandsSouth AfricaSouth AsiaSouth Asia (IDA & IBRD)SpainSri LankaSt. Kitts and NevisSt. LuciaSt. Vincent and the GrenadinesSub-Saharan Africa Sub-Saharan Africa (excluding high income)Sub-Saharan Africa (IDA & IBRD countries)SurinameSwazilandSwedenSwitzerlandSyrian Arab RepublicTajikistanTanzaniaThailandTimor-LesteTogoTongaTrinidad and TobagoTunisiaTurkeyUgandaUkraineUnited Arab EmiratesUnited KingdomUnited StatesUpper middle incomeUruguayVanuatuVenezuela, RBVietnamWest Bank and GazaWorldYemen, Rep.ZambiaZimbabwe Timeline:
This timeline shows a graph from 1971 to 2016 of Latin America & the Caribbean (IDA & IBRD countries). No data until 1970. Number of actual observations by date: 46.
Source name:
World Development Indicators
Source organization:
International Monetary Fund, Balance of Payments database, supplemented by data from the United Nations Conference on Trade and Development and official national sources.
Categories, topics:
Economy & Growth, Financial Sector
Last updated:
apr 23, 2017
Indicators value changes by year
Minimum:
3.009 mln
jan 1, 1972
Maximum:
61.888 bln
jan 1, 2012
At the date of observation
Value
Absolute change
Change from previous value
jan 1, 1971
20.817 mln
+20.817 mln
0.0%
jan 1, 1972
3.009 mln
-17.808 mln
-85.55%
jan 1, 1973
21.759 mln
+18.75 mln
623.14%
jan 1, 1974
32.292 mln
+10.533 mln
48.41%
jan 1, 1975
69.209 mln
+36.917 mln
114.32%
jan 1, 1976
120.487 mln
+51.278 mln
74.09%
jan 1, 1977
219.742 mln
+99.255 mln
82.38%
jan 1, 1978
172.0 mln
-47.742 mln
-21.73%
jan 1, 1979
152.6 mln
-19.4 mln
-11.28%
jan 1, 1980
175.7 mln
+23.1 mln
15.14%
jan 1, 1981
421.644 mln
+245.944 mln
139.98%
jan 1, 1982
201.067 mln
-220.577 mln
-52.31%
jan 1, 1983
503.142 mln
+302.075 mln
150.24%
jan 1, 1984
350.914 mln
-152.228 mln
-30.26%
jan 1, 1985
397.364 mln
+46.45 mln
13.24%
jan 1, 1986
388.663 mln
-8.702 mln
-2.19%
jan 1, 1987
1.098 bln
+709.678 mln
182.59%
jan 1, 1988
350.854 mln
-747.487 mln
-68.06%
jan 1, 1989
454.471 mln
+103.618 mln
29.53%
jan 1, 1990
918.219 mln
+463.747 mln
102.04%
jan 1, 1991
1.408 bln
+489.293 mln
53.29%
jan 1, 1992
1.586 bln
+178.36 mln
12.67%
jan 1, 1993
2.656 bln
+1.07 bln
67.46%
jan 1, 1994
2.738 bln
+82.595 mln
3.11%
jan 1, 1995
4.6 bln
+1.861 bln
67.98%
jan 1, 1996
3.878 bln
-721.45 mln
-15.68%
jan 1, 1997
4.637 bln
+758.492 mln
19.56%
jan 1, 1998
9.333 bln
+4.697 bln
101.29%
jan 1, 1999
10.704 bln
+1.371 bln
14.69%
jan 1, 2000
10.183 bln
-521.672 mln
-4.87%
jan 1, 2001
7.911 bln
-2.271 bln
-22.31%
jan 1, 2002
4.03 bln
-3.881 bln
-49.06%
jan 1, 2003
4.255 bln
+224.813 mln
5.58%
jan 1, 2004
6.137 bln
+1.882 bln
44.24%
jan 1, 2005
17.612 bln
+11.475 bln
186.97%
jan 1, 2006
19.483 bln
+1.872 bln
10.63%
jan 1, 2007
44.314 bln
+24.831 bln
127.45%
jan 1, 2008
32.907 bln
-11.407 bln
-25.74%
jan 1, 2009
42.569 bln
+9.662 bln
29.36%
jan 1, 2010
18.754 bln
-23.815 bln
-55.94%
jan 1, 2011
60.839 bln
+42.085 bln
224.41%
jan 1, 2012
61.888 bln
+1.049 bln
1.72%
jan 1, 2013
55.207 bln
-6.681 bln
-10.79%
jan 1, 2014
50.341 bln
-4.867 bln
-8.82%
jan 1, 2015
56.61 bln
+6.269 bln
12.45%
jan 1, 2016
50.89 bln
-5.72 bln
-10.1%
Ranking of countries by current statistics by years


Comments: