29
/
en
AIzaSyAYiBZKx7MnpbEhh9jyipgxe19OcubqV5w
April 1, 2024
31576
Europe & Central Asia (excluding high income)
ECA
false
2
1
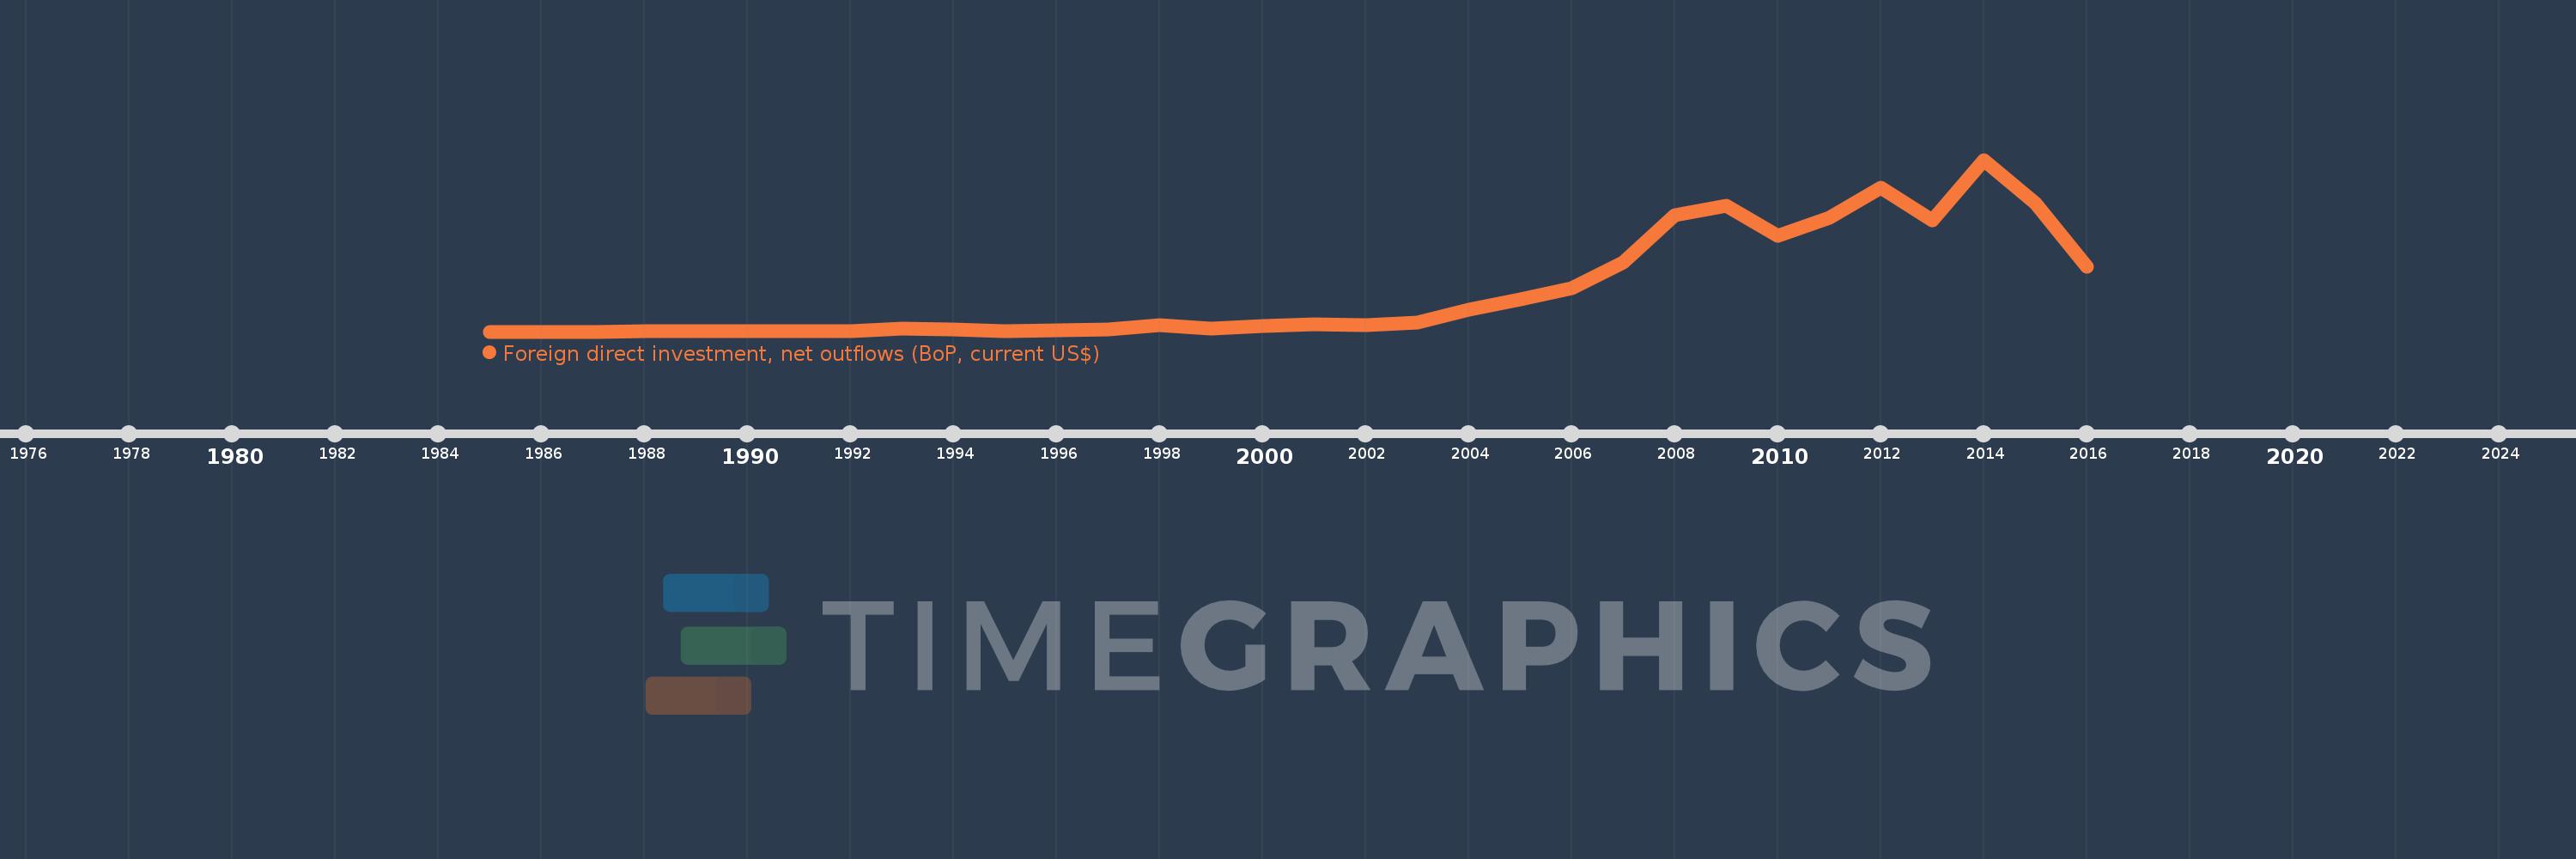
Foreign direct investment, net outflows (BoP, current US$)
2016,2015,2014,2013,2012,2011,2010,2009,2008,2007,2006,2005,2004,2003,2002,2001,2000,1999,1998,1997,1996,1995,1994,1993,1992,1991,1990,1989,1988,1987,1986,1985
This statistics in other country:
AfghanistanAlbaniaAlgeriaAngolaAntigua and BarbudaArab WorldArgentinaArmeniaArubaAustraliaAustriaAzerbaijanBahamas, TheBahrainBangladeshBarbadosBelarusBelgiumBelizeBeninBermudaBoliviaBosnia and HerzegovinaBotswanaBrazilBritish Virgin IslandsBrunei DarussalamBulgariaBurkina FasoBurundiCabo VerdeCambodiaCameroonCanadaCaribbean small statesCayman IslandsCentral African RepublicCentral Europe and the BalticsChadChileChinaColombiaComorosCongo, Dem. Rep.Congo, Rep.Costa RicaCote d'IvoireCroatiaCuracaoCyprusCzech RepublicDenmarkDominicaDominican RepublicEarly-demographic dividendEast Asia & PacificEast Asia & Pacific (excluding high income)East Asia & Pacific (IDA & IBRD countries)EcuadorEgypt, Arab Rep.El SalvadorEquatorial GuineaEritreaEstoniaEuro areaEurope & Central AsiaEurope & Central Asia (excluding high income)Europe & Central Asia (IDA & IBRD countries)European UnionFijiFinlandFragile and conflict affected situationsFranceFrench PolynesiaGabonGambia, TheGeorgiaGermanyGhanaGreeceGrenadaGuatemalaGuineaGuinea-BissauGuyanaHaitiHeavily indebted poor countries (HIPC)High incomeHondurasHong Kong SAR, ChinaHungaryIBRD onlyIcelandIDA & IBRD totalIDA blendIDA onlyIDA totalIndiaIndonesiaIran, Islamic Rep.IraqIrelandIsraelItalyJamaicaJapanJordanKazakhstanKenyaKiribatiKorea, Dem. People’s Rep.Korea, Rep.KosovoKuwaitKyrgyz RepublicLao PDRLate-demographic dividendLatin America & Caribbean Latin America & Caribbean (excluding high income)Latin America & the Caribbean (IDA & IBRD countries)LatviaLeast developed countries: UN classificationLebanonLesothoLiberiaLibyaLithuaniaLow & middle incomeLow incomeLower middle incomeLuxembourgMacao SAR, ChinaMacedonia, FYRMadagascarMalawiMalaysiaMaliMaltaMarshall IslandsMauritaniaMauritiusMexicoMicronesia, Fed. Sts.Middle East & North AfricaMiddle East & North Africa (excluding high income)Middle East & North Africa (IDA & IBRD countries)Middle incomeMoldovaMongoliaMontenegroMoroccoMozambiqueNamibiaNauruNetherlandsNew CaledoniaNew ZealandNicaraguaNigerNigeriaNorth AmericaNorthern Mariana IslandsNorwayOECD membersOmanOther small statesPacific island small statesPakistanPalauPanamaPapua New GuineaParaguayPeruPhilippinesPolandPortugalPost-demographic dividendPre-demographic dividendQatarRomaniaRussian FederationRwandaSamoaSao Tome and PrincipeSaudi ArabiaSenegalSerbiaSeychellesSierra LeoneSingaporeSint Maarten (Dutch part)Slovak RepublicSloveniaSmall statesSolomon IslandsSouth AfricaSouth AsiaSouth Asia (IDA & IBRD)SpainSri LankaSt. Kitts and NevisSt. LuciaSt. Vincent and the GrenadinesSub-Saharan Africa Sub-Saharan Africa (excluding high income)Sub-Saharan Africa (IDA & IBRD countries)SurinameSwazilandSwedenSwitzerlandSyrian Arab RepublicTajikistanTanzaniaThailandTimor-LesteTogoTongaTrinidad and TobagoTunisiaTurkeyUgandaUkraineUnited Arab EmiratesUnited KingdomUnited StatesUpper middle incomeUruguayVanuatuVenezuela, RBVietnamWest Bank and GazaWorldYemen, Rep.ZambiaZimbabwe Timeline:
This timeline shows a graph from 1985 to 2016 of Europe & Central Asia (excluding high income). No data until 1984. Number of actual observations by date: 32.
Source name:
World Development Indicators
Source organization:
International Monetary Fund, Balance of Payments database, supplemented by data from the United Nations Conference on Trade and Development and official national sources.
Categories, topics:
Economy & Growth, Financial Sector
Last updated:
apr 23, 2017
Indicators value changes by year
Maximum:
95.2 bln
jan 1, 2014
At the date of observation
Value
Absolute change
Change from previous value
jan 1, 1985
10.0K
+10.0K
0.0%
jan 1, 1986
10.0K
0.0
0.0%
jan 1, 1987
10.0K
0.0
0.0%
jan 1, 1988
15.12 mln
+15.11 mln
151.1K%
jan 1, 1989
15.384 mln
+263.943K
1.75%
jan 1, 1990
2.214 mln
-13.17 mln
-85.61%
jan 1, 1991
30.494 mln
+28.28 mln
1.28K%
jan 1, 1992
23.93 mln
-6.564 mln
-21.53%
jan 1, 1993
1.632 bln
+1.608 bln
6.72K%
jan 1, 1994
1.084 bln
-548.69 mln
-33.61%
jan 1, 1995
344.254 mln
-739.342 mln
-68.23%
jan 1, 1996
723.08 mln
+378.826 mln
110.04%
jan 1, 1997
1.002 bln
+278.856 mln
38.56%
jan 1, 1998
3.471 bln
+2.469 bln
246.45%
jan 1, 1999
1.668 bln
-1.803 bln
-51.94%
jan 1, 2000
2.907 bln
+1.239 bln
74.27%
jan 1, 2001
4.145 bln
+1.238 bln
42.57%
jan 1, 2002
3.637 bln
-508.356 mln
-12.26%
jan 1, 2003
4.905 bln
+1.268 bln
34.86%
jan 1, 2004
12.216 bln
+7.311 bln
149.06%
jan 1, 2005
17.617 bln
+5.401 bln
44.21%
jan 1, 2006
24.076 bln
+6.46 bln
36.67%
jan 1, 2007
38.389 bln
+14.312 bln
59.45%
jan 1, 2008
64.549 bln
+26.16 bln
68.15%
jan 1, 2009
69.817 bln
+5.268 bln
8.16%
jan 1, 2010
52.873 bln
-16.945 bln
-24.27%
jan 1, 2011
63.141 bln
+10.268 bln
19.42%
jan 1, 2012
79.82 bln
+16.679 bln
26.42%
jan 1, 2013
61.508 bln
-18.311 bln
-22.94%
jan 1, 2014
95.2 bln
+33.692 bln
54.78%
jan 1, 2015
71.086 bln
-24.114 bln
-25.33%
jan 1, 2016
35.977 bln
-35.109 bln
-49.39%
Ranking of countries by current statistics by years


Comments: