29
/
en
AIzaSyAYiBZKx7MnpbEhh9jyipgxe19OcubqV5w
April 1, 2024
53395
Other small states
OSS
false
2
1
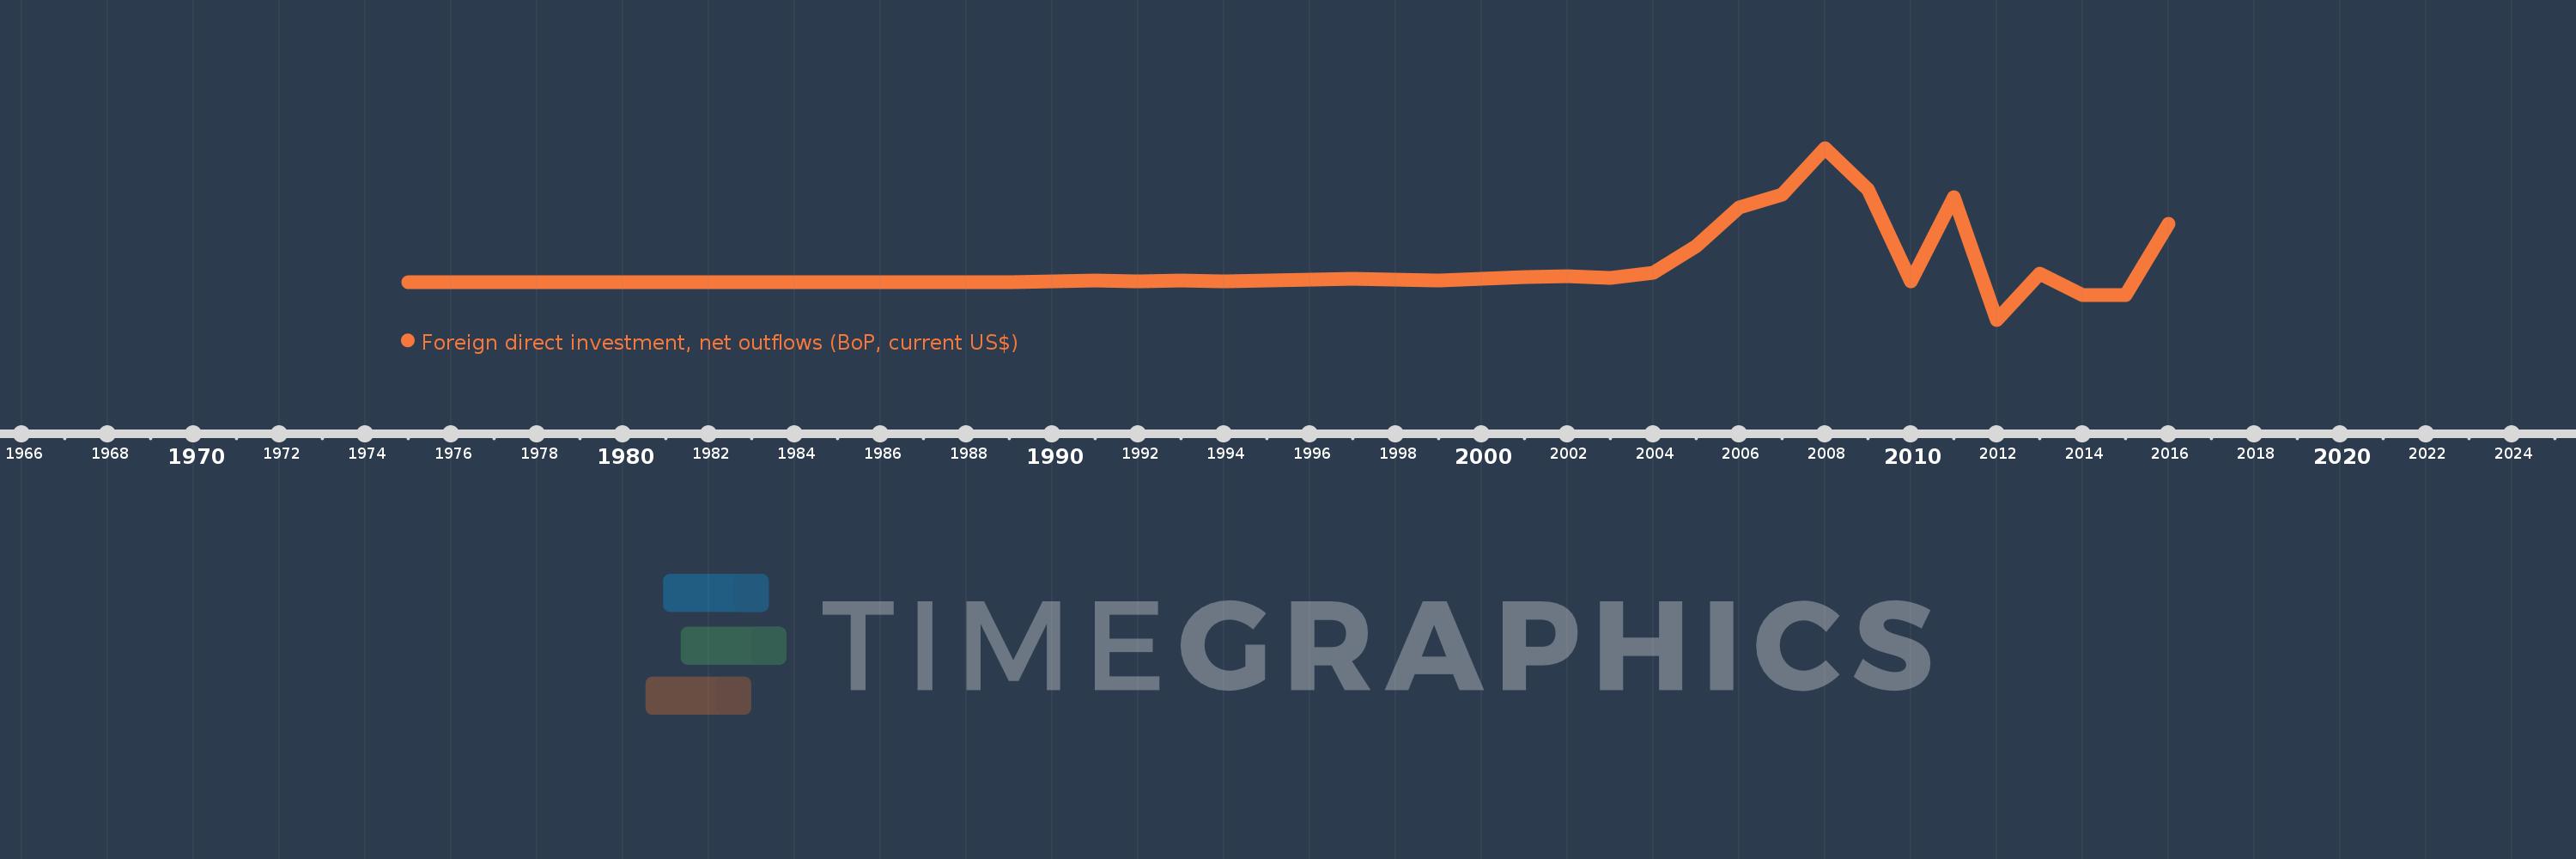
Foreign direct investment, net outflows (BoP, current US$)
2016,2015,2014,2013,2012,2011,2010,2009,2008,2007,2006,2005,2004,2003,2002,2001,2000,1999,1998,1997,1996,1995,1994,1993,1992,1991,1990,1989,1988,1987,1986,1985,1984,1983,1982,1981,1980,1979,1978,1977,1976,1975
This statistics in other country:
AfghanistanAlbaniaAlgeriaAngolaAntigua and BarbudaArab WorldArgentinaArmeniaArubaAustraliaAustriaAzerbaijanBahamas, TheBahrainBangladeshBarbadosBelarusBelgiumBelizeBeninBermudaBoliviaBosnia and HerzegovinaBotswanaBrazilBritish Virgin IslandsBrunei DarussalamBulgariaBurkina FasoBurundiCabo VerdeCambodiaCameroonCanadaCaribbean small statesCayman IslandsCentral African RepublicCentral Europe and the BalticsChadChileChinaColombiaComorosCongo, Dem. Rep.Congo, Rep.Costa RicaCote d'IvoireCroatiaCuracaoCyprusCzech RepublicDenmarkDominicaDominican RepublicEarly-demographic dividendEast Asia & PacificEast Asia & Pacific (excluding high income)East Asia & Pacific (IDA & IBRD countries)EcuadorEgypt, Arab Rep.El SalvadorEquatorial GuineaEritreaEstoniaEuro areaEurope & Central AsiaEurope & Central Asia (excluding high income)Europe & Central Asia (IDA & IBRD countries)European UnionFijiFinlandFragile and conflict affected situationsFranceFrench PolynesiaGabonGambia, TheGeorgiaGermanyGhanaGreeceGrenadaGuatemalaGuineaGuinea-BissauGuyanaHaitiHeavily indebted poor countries (HIPC)High incomeHondurasHong Kong SAR, ChinaHungaryIBRD onlyIcelandIDA & IBRD totalIDA blendIDA onlyIDA totalIndiaIndonesiaIran, Islamic Rep.IraqIrelandIsraelItalyJamaicaJapanJordanKazakhstanKenyaKiribatiKorea, Dem. People’s Rep.Korea, Rep.KosovoKuwaitKyrgyz RepublicLao PDRLate-demographic dividendLatin America & Caribbean Latin America & Caribbean (excluding high income)Latin America & the Caribbean (IDA & IBRD countries)LatviaLeast developed countries: UN classificationLebanonLesothoLiberiaLibyaLithuaniaLow & middle incomeLow incomeLower middle incomeLuxembourgMacao SAR, ChinaMacedonia, FYRMadagascarMalawiMalaysiaMaliMaltaMarshall IslandsMauritaniaMauritiusMexicoMicronesia, Fed. Sts.Middle East & North AfricaMiddle East & North Africa (excluding high income)Middle East & North Africa (IDA & IBRD countries)Middle incomeMoldovaMongoliaMontenegroMoroccoMozambiqueNamibiaNauruNetherlandsNew CaledoniaNew ZealandNicaraguaNigerNigeriaNorth AmericaNorthern Mariana IslandsNorwayOECD membersOmanOther small statesPacific island small statesPakistanPalauPanamaPapua New GuineaParaguayPeruPhilippinesPolandPortugalPost-demographic dividendPre-demographic dividendQatarRomaniaRussian FederationRwandaSamoaSao Tome and PrincipeSaudi ArabiaSenegalSerbiaSeychellesSierra LeoneSingaporeSint Maarten (Dutch part)Slovak RepublicSloveniaSmall statesSolomon IslandsSouth AfricaSouth AsiaSouth Asia (IDA & IBRD)SpainSri LankaSt. Kitts and NevisSt. LuciaSt. Vincent and the GrenadinesSub-Saharan Africa Sub-Saharan Africa (excluding high income)Sub-Saharan Africa (IDA & IBRD countries)SurinameSwazilandSwedenSwitzerlandSyrian Arab RepublicTajikistanTanzaniaThailandTimor-LesteTogoTongaTrinidad and TobagoTunisiaTurkeyUgandaUkraineUnited Arab EmiratesUnited KingdomUnited StatesUpper middle incomeUruguayVanuatuVenezuela, RBVietnamWest Bank and GazaWorldYemen, Rep.ZambiaZimbabwe Timeline:
This timeline shows a graph from 1975 to 2016 of Other small states. No data until 1974. Number of actual observations by date: 42.
Source name:
World Development Indicators
Source organization:
International Monetary Fund, Balance of Payments database, supplemented by data from the United Nations Conference on Trade and Development and official national sources.
Categories, topics:
Economy & Growth, Financial Sector
Last updated:
apr 23, 2017
Indicators value changes by year
Minimum:
-10.152 bln
jan 1, 2012
Maximum:
36.064 bln
jan 1, 2008
At the date of observation
Value
Absolute change
Change from previous value
jan 1, 1975
-3.0 mln
-3.0 mln
0.0%
jan 1, 1976
7.0 mln
+10.0 mln
-333.33%
jan 1, 1977
39.688 mln
+32.688 mln
466.97%
jan 1, 1978
21.744 mln
-17.944 mln
-45.21%
jan 1, 1979
3.513 mln
-18.231 mln
-83.84%
jan 1, 1980
7.32 mln
+3.806 mln
108.35%
jan 1, 1981
25.116 mln
+17.797 mln
243.14%
jan 1, 1982
11.639 mln
-13.477 mln
-53.66%
jan 1, 1983
15.468 mln
+3.829 mln
32.9%
jan 1, 1984
10.778 mln
-4.69 mln
-30.32%
jan 1, 1985
10.303 mln
-474.958K
-4.41%
jan 1, 1986
11.57 mln
+1.266 mln
12.29%
jan 1, 1987
44.172 mln
+32.602 mln
281.79%
jan 1, 1988
40.464 mln
-3.707 mln
-8.39%
jan 1, 1989
38.877 mln
-1.588 mln
-3.92%
jan 1, 1990
63.759 mln
+24.882 mln
64.0%
jan 1, 1991
323.529 mln
+259.77 mln
407.42%
jan 1, 1992
138.152 mln
-185.377 mln
-57.3%
jan 1, 1993
332.433 mln
+194.281 mln
140.63%
jan 1, 1994
166.569 mln
-165.864 mln
-49.89%
jan 1, 1995
391.278 mln
+224.709 mln
134.9%
jan 1, 1996
598.747 mln
+207.469 mln
53.02%
jan 1, 1997
853.889 mln
+255.142 mln
42.61%
jan 1, 1998
619.918 mln
-233.972 mln
-27.4%
jan 1, 1999
509.866 mln
-110.052 mln
-17.75%
jan 1, 2000
811.621 mln
+301.754 mln
59.18%
jan 1, 2001
1.271 bln
+459.646 mln
56.63%
jan 1, 2002
1.612 bln
+341.157 mln
26.84%
jan 1, 2003
1.213 bln
-398.998 mln
-24.75%
jan 1, 2004
2.58 bln
+1.366 bln
112.61%
jan 1, 2005
9.611 bln
+7.032 bln
272.56%
jan 1, 2006
20.154 bln
+10.542 bln
109.68%
jan 1, 2007
23.565 bln
+3.411 bln
16.93%
jan 1, 2008
36.064 bln
+12.499 bln
53.04%
jan 1, 2009
24.877 bln
-11.188 bln
-31.02%
jan 1, 2010
200.04 mln
-24.677 bln
-99.2%
jan 1, 2011
22.73 bln
+22.53 bln
11.26K%
jan 1, 2012
-10.152 bln
-32.882 bln
-144.66%
jan 1, 2013
2.371 bln
+12.522 bln
-123.35%
jan 1, 2014
-3.582 bln
-5.953 bln
-251.12%
jan 1, 2015
-3.434 bln
+148.129 mln
-4.13%
jan 1, 2016
15.618 bln
+19.052 bln
-554.78%
Ranking of countries by current statistics by years


Comments: