29
/
en
AIzaSyAYiBZKx7MnpbEhh9jyipgxe19OcubqV5w
April 1, 2024
131978
Fiji
FJI
true
2
1
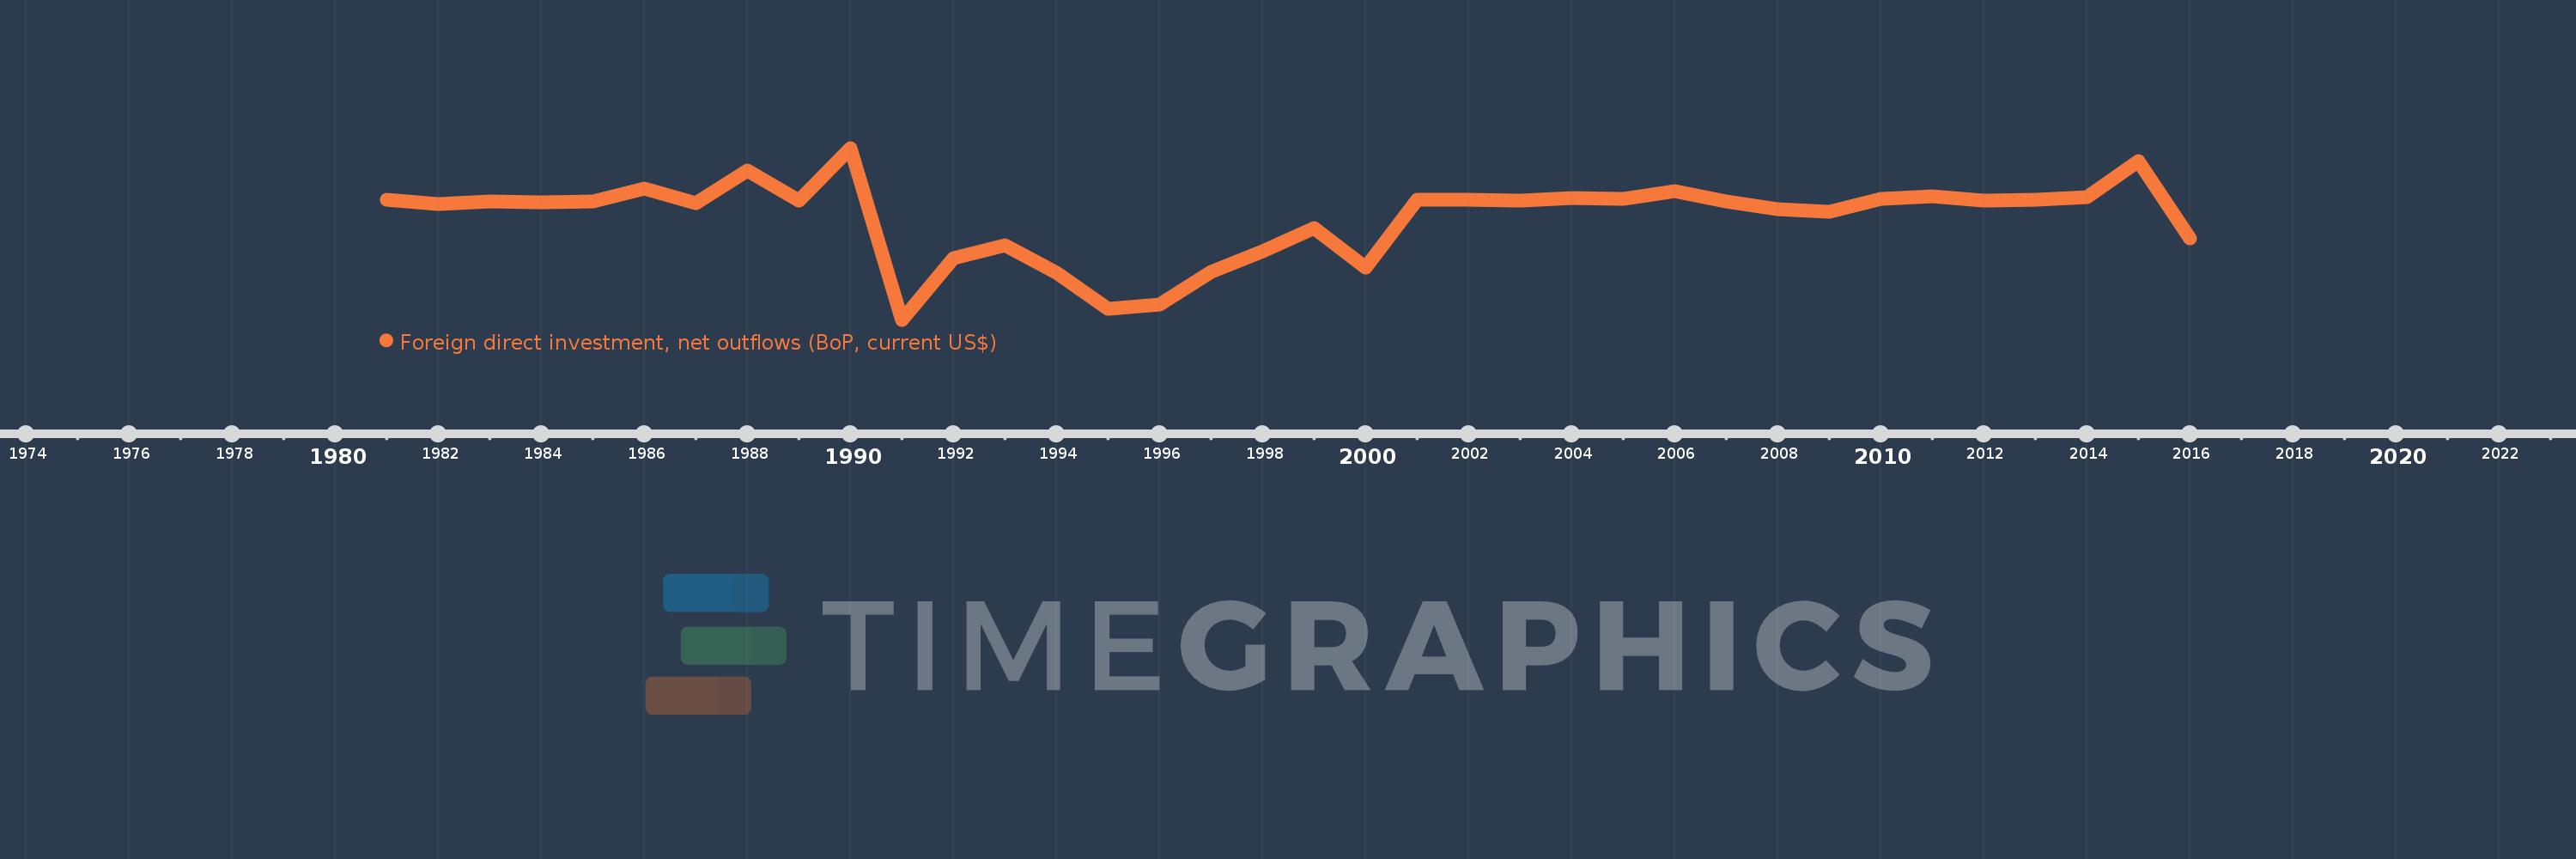
Foreign direct investment, net outflows (BoP, current US$)
2016,2015,2014,2013,2012,2011,2010,2009,2008,2007,2006,2005,2004,2003,2002,2001,2000,1999,1998,1997,1996,1995,1994,1993,1992,1991,1990,1989,1988,1987,1986,1985,1984,1983,1982,1981
This statistics in other country:
AfghanistanAlbaniaAlgeriaAngolaAntigua and BarbudaArab WorldArgentinaArmeniaArubaAustraliaAustriaAzerbaijanBahamas, TheBahrainBangladeshBarbadosBelarusBelgiumBelizeBeninBermudaBoliviaBosnia and HerzegovinaBotswanaBrazilBritish Virgin IslandsBrunei DarussalamBulgariaBurkina FasoBurundiCabo VerdeCambodiaCameroonCanadaCaribbean small statesCayman IslandsCentral African RepublicCentral Europe and the BalticsChadChileChinaColombiaComorosCongo, Dem. Rep.Congo, Rep.Costa RicaCote d'IvoireCroatiaCuracaoCyprusCzech RepublicDenmarkDominicaDominican RepublicEarly-demographic dividendEast Asia & PacificEast Asia & Pacific (excluding high income)East Asia & Pacific (IDA & IBRD countries)EcuadorEgypt, Arab Rep.El SalvadorEquatorial GuineaEritreaEstoniaEuro areaEurope & Central AsiaEurope & Central Asia (excluding high income)Europe & Central Asia (IDA & IBRD countries)European UnionFijiFinlandFragile and conflict affected situationsFranceFrench PolynesiaGabonGambia, TheGeorgiaGermanyGhanaGreeceGrenadaGuatemalaGuineaGuinea-BissauGuyanaHaitiHeavily indebted poor countries (HIPC)High incomeHondurasHong Kong SAR, ChinaHungaryIBRD onlyIcelandIDA & IBRD totalIDA blendIDA onlyIDA totalIndiaIndonesiaIran, Islamic Rep.IraqIrelandIsraelItalyJamaicaJapanJordanKazakhstanKenyaKiribatiKorea, Dem. People’s Rep.Korea, Rep.KosovoKuwaitKyrgyz RepublicLao PDRLate-demographic dividendLatin America & Caribbean Latin America & Caribbean (excluding high income)Latin America & the Caribbean (IDA & IBRD countries)LatviaLeast developed countries: UN classificationLebanonLesothoLiberiaLibyaLithuaniaLow & middle incomeLow incomeLower middle incomeLuxembourgMacao SAR, ChinaMacedonia, FYRMadagascarMalawiMalaysiaMaliMaltaMarshall IslandsMauritaniaMauritiusMexicoMicronesia, Fed. Sts.Middle East & North AfricaMiddle East & North Africa (excluding high income)Middle East & North Africa (IDA & IBRD countries)Middle incomeMoldovaMongoliaMontenegroMoroccoMozambiqueNamibiaNauruNetherlandsNew CaledoniaNew ZealandNicaraguaNigerNigeriaNorth AmericaNorthern Mariana IslandsNorwayOECD membersOmanOther small statesPacific island small statesPakistanPalauPanamaPapua New GuineaParaguayPeruPhilippinesPolandPortugalPost-demographic dividendPre-demographic dividendQatarRomaniaRussian FederationRwandaSamoaSao Tome and PrincipeSaudi ArabiaSenegalSerbiaSeychellesSierra LeoneSingaporeSint Maarten (Dutch part)Slovak RepublicSloveniaSmall statesSolomon IslandsSouth AfricaSouth AsiaSouth Asia (IDA & IBRD)SpainSri LankaSt. Kitts and NevisSt. LuciaSt. Vincent and the GrenadinesSub-Saharan Africa Sub-Saharan Africa (excluding high income)Sub-Saharan Africa (IDA & IBRD countries)SurinameSwazilandSwedenSwitzerlandSyrian Arab RepublicTajikistanTanzaniaThailandTimor-LesteTogoTongaTrinidad and TobagoTunisiaTurkeyUgandaUkraineUnited Arab EmiratesUnited KingdomUnited StatesUpper middle incomeUruguayVanuatuVenezuela, RBVietnamWest Bank and GazaWorldYemen, Rep.ZambiaZimbabwe Timeline:
This timeline shows a graph from 1981 to 2016 of Fiji. No data until 1980. Number of actual observations by date: 36.
Source name:
World Development Indicators
Source organization:
International Monetary Fund, Balance of Payments database, supplemented by data from the United Nations Conference on Trade and Development and official national sources.
Categories, topics:
Economy & Growth, Financial Sector
Last updated:
apr 23, 2017
Indicators value changes by year
Minimum:
-109.169 mln
jan 1, 1991
Maximum:
50.427 mln
jan 1, 1990
At the date of observation
Value
Absolute change
Change from previous value
jan 1, 1981
2.201 mln
+2.201 mln
0.0%
jan 1, 1982
-1.509 mln
-3.71 mln
-168.59%
jan 1, 1983
804.334K
+2.314 mln
-153.29%
jan 1, 1984
98.326K
-706.007K
-87.78%
jan 1, 1985
554.223K
+455.897K
463.66%
jan 1, 1986
13.003 mln
+12.449 mln
2.25K%
jan 1, 1987
-706.174K
-13.709 mln
-105.43%
jan 1, 1988
29.183 mln
+29.89 mln
-4.23K%
jan 1, 1989
1.468 mln
-27.715 mln
-94.97%
jan 1, 1990
50.427 mln
+48.959 mln
3.33K%
jan 1, 1991
-109.169 mln
-159.596 mln
-316.49%
jan 1, 1992
-52.116 mln
+57.054 mln
-52.26%
jan 1, 1993
-39.994 mln
+12.122 mln
-23.26%
jan 1, 1994
-65.574 mln
-25.58 mln
63.96%
jan 1, 1995
-99.104 mln
-33.53 mln
51.13%
jan 1, 1996
-95.07 mln
+4.034 mln
-4.07%
jan 1, 1997
-64.776 mln
+30.294 mln
-31.87%
jan 1, 1998
-45.786 mln
+18.99 mln
-29.32%
jan 1, 1999
-24.059 mln
+21.727 mln
-47.45%
jan 1, 2000
-60.875 mln
-36.816 mln
153.03%
jan 1, 2001
2.306 mln
+63.181 mln
-103.79%
jan 1, 2002
2.646 mln
+339.763K
14.73%
jan 1, 2003
1.72 mln
-925.616K
-34.98%
jan 1, 2004
3.851 mln
+2.131 mln
123.87%
jan 1, 2005
3.239 mln
-612.324K
-15.9%
jan 1, 2006
10.344 mln
+7.105 mln
219.36%
jan 1, 2007
577.857K
-9.766 mln
-94.41%
jan 1, 2008
-6.419 mln
-6.997 mln
-1.21K%
jan 1, 2009
-8.776 mln
-2.357 mln
36.72%
jan 1, 2010
3.038 mln
+11.814 mln
-134.62%
jan 1, 2011
5.86 mln
+2.822 mln
92.89%
jan 1, 2012
1.2 mln
-4.66 mln
-79.52%
jan 1, 2013
1.951 mln
+750.433K
62.53%
jan 1, 2014
4.489 mln
+2.538 mln
130.11%
jan 1, 2015
38.35 mln
+33.861 mln
754.38%
jan 1, 2016
-33.99 mln
-72.34 mln
-188.63%
Ranking of countries by current statistics by years


Comments: