29
/
en
AIzaSyAYiBZKx7MnpbEhh9jyipgxe19OcubqV5w
April 1, 2024
55513
Pre-demographic dividend
PRE
false
2
1
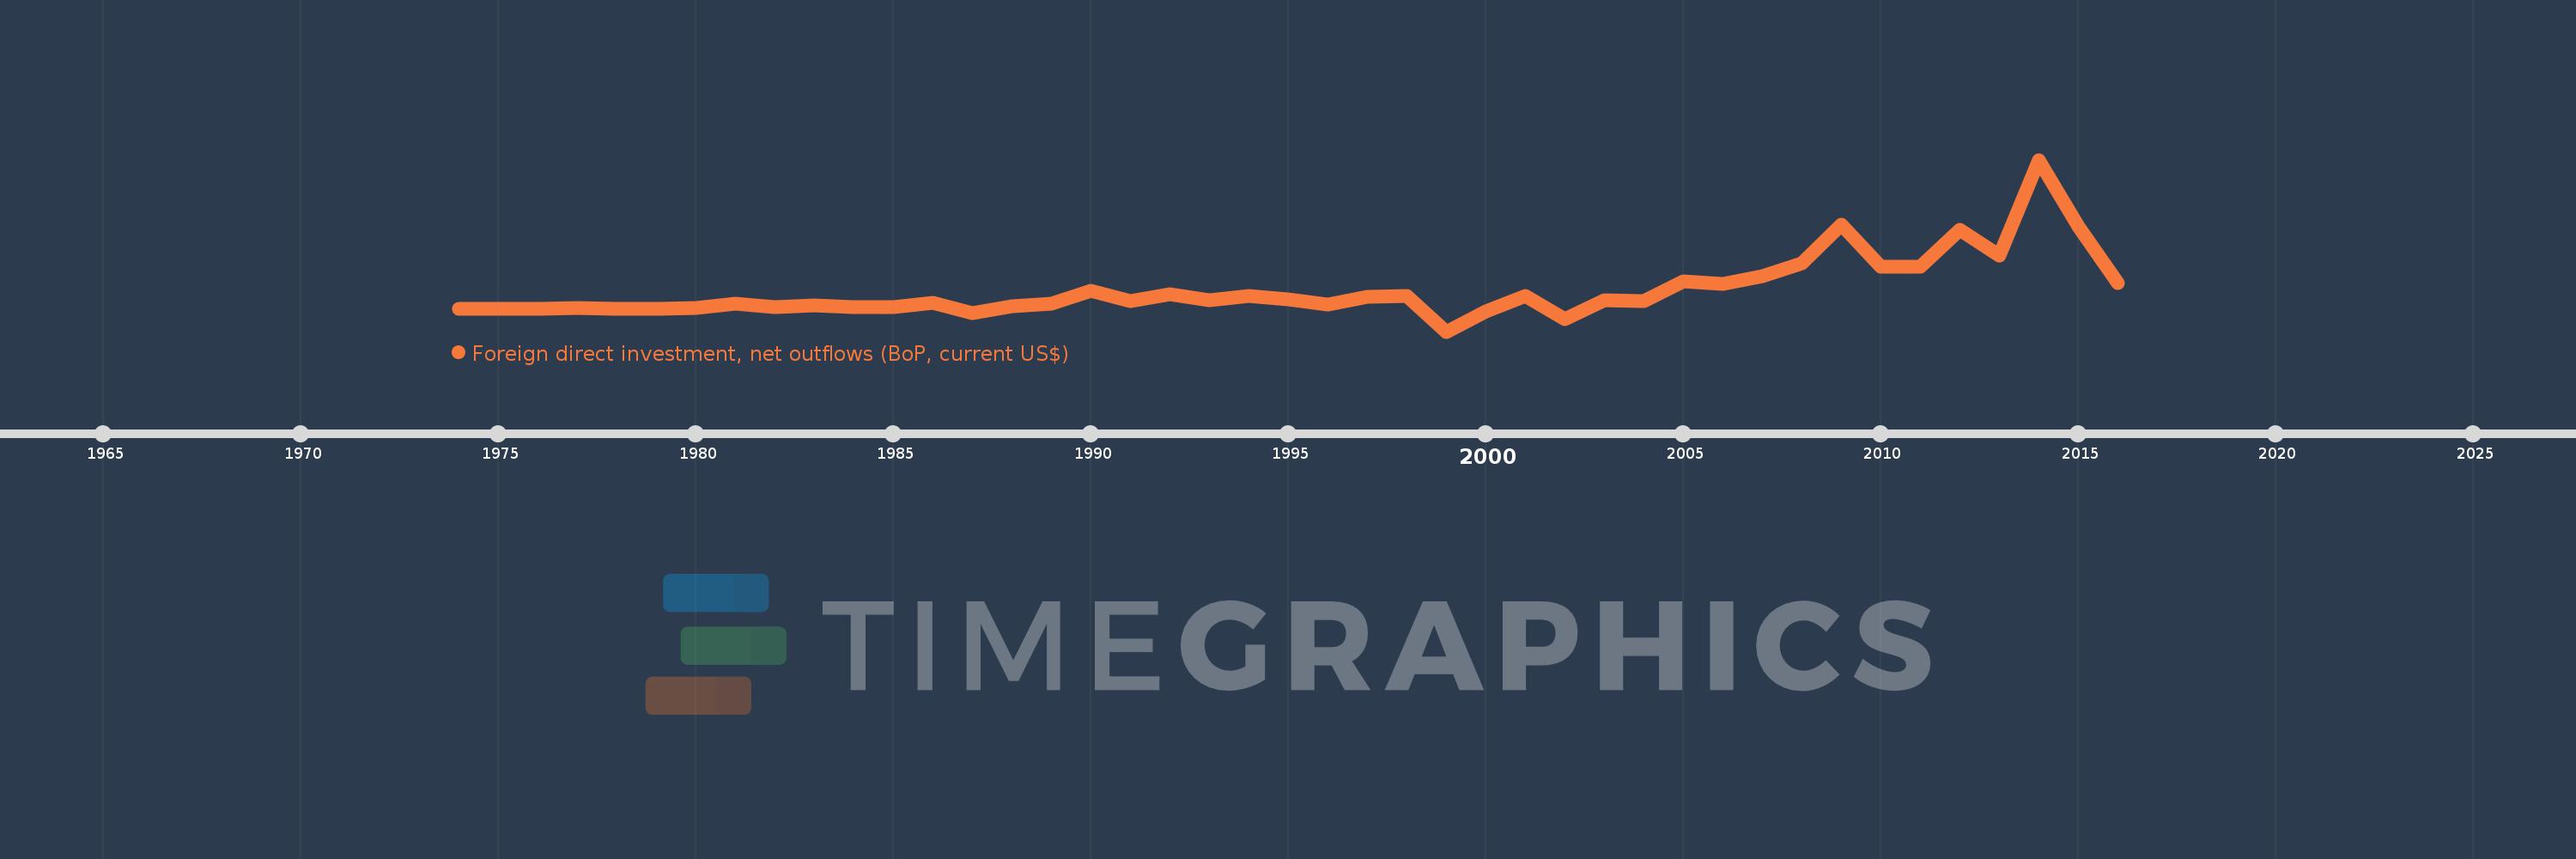
Foreign direct investment, net outflows (BoP, current US$)
2016,2015,2014,2013,2012,2011,2010,2009,2008,2007,2006,2005,2004,2003,2002,2001,2000,1999,1998,1997,1996,1995,1994,1993,1992,1991,1990,1989,1988,1987,1986,1985,1984,1983,1982,1981,1980,1979,1978,1977,1976,1975,1974
This statistics in other country:
AfghanistanAlbaniaAlgeriaAngolaAntigua and BarbudaArab WorldArgentinaArmeniaArubaAustraliaAustriaAzerbaijanBahamas, TheBahrainBangladeshBarbadosBelarusBelgiumBelizeBeninBermudaBoliviaBosnia and HerzegovinaBotswanaBrazilBritish Virgin IslandsBrunei DarussalamBulgariaBurkina FasoBurundiCabo VerdeCambodiaCameroonCanadaCaribbean small statesCayman IslandsCentral African RepublicCentral Europe and the BalticsChadChileChinaColombiaComorosCongo, Dem. Rep.Congo, Rep.Costa RicaCote d'IvoireCroatiaCuracaoCyprusCzech RepublicDenmarkDominicaDominican RepublicEarly-demographic dividendEast Asia & PacificEast Asia & Pacific (excluding high income)East Asia & Pacific (IDA & IBRD countries)EcuadorEgypt, Arab Rep.El SalvadorEquatorial GuineaEritreaEstoniaEuro areaEurope & Central AsiaEurope & Central Asia (excluding high income)Europe & Central Asia (IDA & IBRD countries)European UnionFijiFinlandFragile and conflict affected situationsFranceFrench PolynesiaGabonGambia, TheGeorgiaGermanyGhanaGreeceGrenadaGuatemalaGuineaGuinea-BissauGuyanaHaitiHeavily indebted poor countries (HIPC)High incomeHondurasHong Kong SAR, ChinaHungaryIBRD onlyIcelandIDA & IBRD totalIDA blendIDA onlyIDA totalIndiaIndonesiaIran, Islamic Rep.IraqIrelandIsraelItalyJamaicaJapanJordanKazakhstanKenyaKiribatiKorea, Dem. People’s Rep.Korea, Rep.KosovoKuwaitKyrgyz RepublicLao PDRLate-demographic dividendLatin America & Caribbean Latin America & Caribbean (excluding high income)Latin America & the Caribbean (IDA & IBRD countries)LatviaLeast developed countries: UN classificationLebanonLesothoLiberiaLibyaLithuaniaLow & middle incomeLow incomeLower middle incomeLuxembourgMacao SAR, ChinaMacedonia, FYRMadagascarMalawiMalaysiaMaliMaltaMarshall IslandsMauritaniaMauritiusMexicoMicronesia, Fed. Sts.Middle East & North AfricaMiddle East & North Africa (excluding high income)Middle East & North Africa (IDA & IBRD countries)Middle incomeMoldovaMongoliaMontenegroMoroccoMozambiqueNamibiaNauruNetherlandsNew CaledoniaNew ZealandNicaraguaNigerNigeriaNorth AmericaNorthern Mariana IslandsNorwayOECD membersOmanOther small statesPacific island small statesPakistanPalauPanamaPapua New GuineaParaguayPeruPhilippinesPolandPortugalPost-demographic dividendPre-demographic dividendQatarRomaniaRussian FederationRwandaSamoaSao Tome and PrincipeSaudi ArabiaSenegalSerbiaSeychellesSierra LeoneSingaporeSint Maarten (Dutch part)Slovak RepublicSloveniaSmall statesSolomon IslandsSouth AfricaSouth AsiaSouth Asia (IDA & IBRD)SpainSri LankaSt. Kitts and NevisSt. LuciaSt. Vincent and the GrenadinesSub-Saharan Africa Sub-Saharan Africa (excluding high income)Sub-Saharan Africa (IDA & IBRD countries)SurinameSwazilandSwedenSwitzerlandSyrian Arab RepublicTajikistanTanzaniaThailandTimor-LesteTogoTongaTrinidad and TobagoTunisiaTurkeyUgandaUkraineUnited Arab EmiratesUnited KingdomUnited StatesUpper middle incomeUruguayVanuatuVenezuela, RBVietnamWest Bank and GazaWorldYemen, Rep.ZambiaZimbabwe Timeline:
This timeline shows a graph from 1974 to 2016 of Pre-demographic dividend. No data until 1973. Number of actual observations by date: 43.
Source name:
World Development Indicators
Source organization:
International Monetary Fund, Balance of Payments database, supplemented by data from the United Nations Conference on Trade and Development and official national sources.
Categories, topics:
Economy & Growth, Financial Sector
Last updated:
apr 23, 2017
Indicators value changes by year
Minimum:
-1.072 bln
jan 1, 1999
Maximum:
6.999 bln
jan 1, 2014
At the date of observation
Value
Absolute change
Change from previous value
jan 1, 1974
4.0 mln
+4.0 mln
0.0%
jan 1, 1975
11.93 mln
+7.93 mln
198.25%
jan 1, 1976
5.102 mln
-6.828 mln
-57.24%
jan 1, 1977
18.383 mln
+13.281 mln
260.31%
jan 1, 1978
14.764 mln
-3.619 mln
-19.69%
jan 1, 1979
10.178 mln
-4.586 mln
-31.06%
jan 1, 1980
22.98 mln
+12.802 mln
125.78%
jan 1, 1981
231.299 mln
+208.319 mln
906.53%
jan 1, 1982
72.379 mln
-158.92 mln
-68.71%
jan 1, 1983
173.566 mln
+101.188 mln
139.8%
jan 1, 1984
86.269 mln
-87.297 mln
-50.3%
jan 1, 1985
84.548 mln
-1.721 mln
-1.99%
jan 1, 1986
279.169 mln
+194.621 mln
230.19%
jan 1, 1987
-202.039 mln
-481.208 mln
-172.37%
jan 1, 1988
120.918 mln
+322.957 mln
-159.85%
jan 1, 1989
248.595 mln
+127.677 mln
105.59%
jan 1, 1990
859.914 mln
+611.319 mln
245.91%
jan 1, 1991
371.36 mln
-488.555 mln
-56.81%
jan 1, 1992
677.9 mln
+306.541 mln
82.55%
jan 1, 1993
392.377 mln
-285.523 mln
-42.12%
jan 1, 1994
619.705 mln
+227.328 mln
57.94%
jan 1, 1995
446.064 mln
-173.641 mln
-28.02%
jan 1, 1996
180.571 mln
-265.492 mln
-59.52%
jan 1, 1997
574.15 mln
+393.578 mln
217.96%
jan 1, 1998
615.106 mln
+40.956 mln
7.13%
jan 1, 1999
-1.072 bln
-1.687 bln
-274.25%
jan 1, 2000
-128.843 mln
+943.002 mln
-87.98%
jan 1, 2001
597.163 mln
+726.006 mln
-563.48%
jan 1, 2002
-469.114 mln
-1.066 bln
-178.56%
jan 1, 2003
413.345 mln
+882.459 mln
-188.11%
jan 1, 2004
352.544 mln
-60.801 mln
-14.71%
jan 1, 2005
1.294 bln
+941.335 mln
267.01%
jan 1, 2006
1.168 bln
-125.687 mln
-9.71%
jan 1, 2007
1.514 bln
+345.86 mln
29.61%
jan 1, 2008
2.139 bln
+625.091 mln
41.29%
jan 1, 2009
3.959 bln
+1.82 bln
85.07%
jan 1, 2010
1.967 bln
-1.992 bln
-50.32%
jan 1, 2011
1.962 bln
-4.7 mln
-0.24%
jan 1, 2012
3.73 bln
+1.768 bln
90.11%
jan 1, 2013
2.509 bln
-1.221 bln
-32.75%
jan 1, 2014
6.999 bln
+4.49 bln
178.99%
jan 1, 2015
3.859 bln
-3.14 bln
-44.87%
jan 1, 2016
1.198 bln
-2.661 bln
-68.96%
Ranking of countries by current statistics by years


Comments: