29
/
en
AIzaSyAYiBZKx7MnpbEhh9jyipgxe19OcubqV5w
April 1, 2024
27274
East Asia & Pacific
EAS
false
2
1
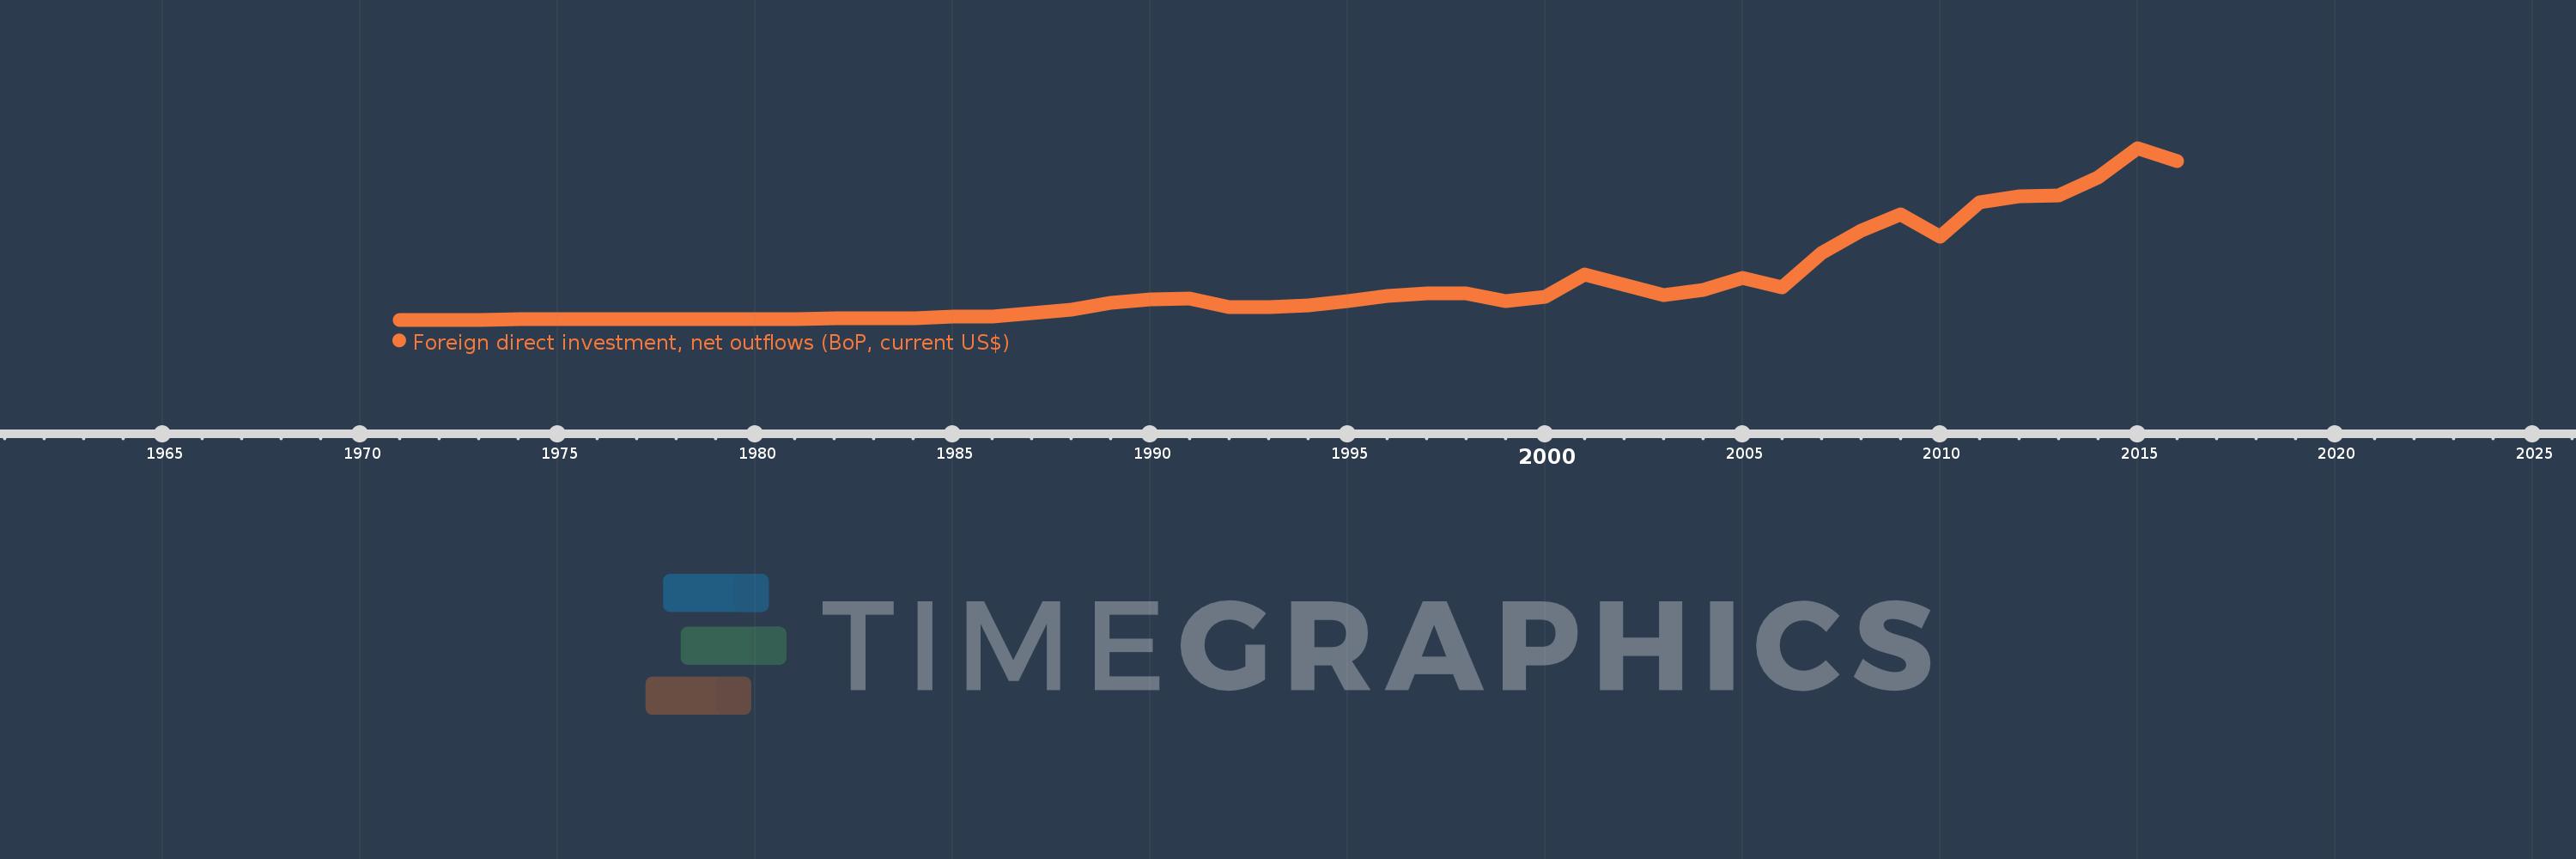
Foreign direct investment, net outflows (BoP, current US$)
2016,2015,2014,2013,2012,2011,2010,2009,2008,2007,2006,2005,2004,2003,2002,2001,2000,1999,1998,1997,1996,1995,1994,1993,1992,1991,1990,1989,1988,1987,1986,1985,1984,1983,1982,1981,1980,1979,1978,1977,1976,1975,1974,1973,1972,1971
This statistics in other country:
AfghanistanAlbaniaAlgeriaAngolaAntigua and BarbudaArab WorldArgentinaArmeniaArubaAustraliaAustriaAzerbaijanBahamas, TheBahrainBangladeshBarbadosBelarusBelgiumBelizeBeninBermudaBoliviaBosnia and HerzegovinaBotswanaBrazilBritish Virgin IslandsBrunei DarussalamBulgariaBurkina FasoBurundiCabo VerdeCambodiaCameroonCanadaCaribbean small statesCayman IslandsCentral African RepublicCentral Europe and the BalticsChadChileChinaColombiaComorosCongo, Dem. Rep.Congo, Rep.Costa RicaCote d'IvoireCroatiaCuracaoCyprusCzech RepublicDenmarkDominicaDominican RepublicEarly-demographic dividendEast Asia & PacificEast Asia & Pacific (excluding high income)East Asia & Pacific (IDA & IBRD countries)EcuadorEgypt, Arab Rep.El SalvadorEquatorial GuineaEritreaEstoniaEuro areaEurope & Central AsiaEurope & Central Asia (excluding high income)Europe & Central Asia (IDA & IBRD countries)European UnionFijiFinlandFragile and conflict affected situationsFranceFrench PolynesiaGabonGambia, TheGeorgiaGermanyGhanaGreeceGrenadaGuatemalaGuineaGuinea-BissauGuyanaHaitiHeavily indebted poor countries (HIPC)High incomeHondurasHong Kong SAR, ChinaHungaryIBRD onlyIcelandIDA & IBRD totalIDA blendIDA onlyIDA totalIndiaIndonesiaIran, Islamic Rep.IraqIrelandIsraelItalyJamaicaJapanJordanKazakhstanKenyaKiribatiKorea, Dem. People’s Rep.Korea, Rep.KosovoKuwaitKyrgyz RepublicLao PDRLate-demographic dividendLatin America & Caribbean Latin America & Caribbean (excluding high income)Latin America & the Caribbean (IDA & IBRD countries)LatviaLeast developed countries: UN classificationLebanonLesothoLiberiaLibyaLithuaniaLow & middle incomeLow incomeLower middle incomeLuxembourgMacao SAR, ChinaMacedonia, FYRMadagascarMalawiMalaysiaMaliMaltaMarshall IslandsMauritaniaMauritiusMexicoMicronesia, Fed. Sts.Middle East & North AfricaMiddle East & North Africa (excluding high income)Middle East & North Africa (IDA & IBRD countries)Middle incomeMoldovaMongoliaMontenegroMoroccoMozambiqueNamibiaNauruNetherlandsNew CaledoniaNew ZealandNicaraguaNigerNigeriaNorth AmericaNorthern Mariana IslandsNorwayOECD membersOmanOther small statesPacific island small statesPakistanPalauPanamaPapua New GuineaParaguayPeruPhilippinesPolandPortugalPost-demographic dividendPre-demographic dividendQatarRomaniaRussian FederationRwandaSamoaSao Tome and PrincipeSaudi ArabiaSenegalSerbiaSeychellesSierra LeoneSingaporeSint Maarten (Dutch part)Slovak RepublicSloveniaSmall statesSolomon IslandsSouth AfricaSouth AsiaSouth Asia (IDA & IBRD)SpainSri LankaSt. Kitts and NevisSt. LuciaSt. Vincent and the GrenadinesSub-Saharan Africa Sub-Saharan Africa (excluding high income)Sub-Saharan Africa (IDA & IBRD countries)SurinameSwazilandSwedenSwitzerlandSyrian Arab RepublicTajikistanTanzaniaThailandTimor-LesteTogoTongaTrinidad and TobagoTunisiaTurkeyUgandaUkraineUnited Arab EmiratesUnited KingdomUnited StatesUpper middle incomeUruguayVanuatuVenezuela, RBVietnamWest Bank and GazaWorldYemen, Rep.ZambiaZimbabwe Timeline:
This timeline shows a graph from 1971 to 2016 of East Asia & Pacific. No data until 1970. Number of actual observations by date: 46.
Source name:
World Development Indicators
Source organization:
International Monetary Fund, Balance of Payments database, supplemented by data from the United Nations Conference on Trade and Development and official national sources.
Categories, topics:
Economy & Growth, Financial Sector
Last updated:
apr 23, 2017
Indicators value changes by year
Minimum:
476.364 mln
jan 1, 1971
Maximum:
529.349 bln
jan 1, 2015
At the date of observation
Value
Absolute change
Change from previous value
jan 1, 1971
476.364 mln
+476.364 mln
0.0%
jan 1, 1972
480.498 mln
+4.134 mln
0.87%
jan 1, 1973
879.628 mln
+399.13 mln
83.07%
jan 1, 1974
2.208 bln
+1.328 bln
151.0%
jan 1, 1975
2.319 bln
+110.902 mln
5.02%
jan 1, 1976
1.988 bln
-331.105 mln
-14.28%
jan 1, 1977
2.346 bln
+358.787 mln
18.05%
jan 1, 1978
2.059 bln
-287.296 mln
-12.24%
jan 1, 1979
2.819 bln
+759.979 mln
36.91%
jan 1, 1980
3.494 bln
+675.115 mln
23.95%
jan 1, 1981
3.488 bln
-6.045 mln
-0.17%
jan 1, 1982
6.218 bln
+2.73 bln
78.26%
jan 1, 1983
6.261 bln
+42.782 mln
0.69%
jan 1, 1984
5.684 bln
-576.978 mln
-9.22%
jan 1, 1985
9.125 bln
+3.44 bln
60.53%
jan 1, 1986
11.297 bln
+2.172 bln
23.81%
jan 1, 1987
21.496 bln
+10.2 bln
90.29%
jan 1, 1988
30.626 bln
+9.13 bln
42.47%
jan 1, 1989
51.522 bln
+20.896 bln
68.23%
jan 1, 1990
61.861 bln
+10.339 bln
20.07%
jan 1, 1991
65.646 bln
+3.784 bln
6.12%
jan 1, 1992
40.171 bln
-25.475 bln
-38.81%
jan 1, 1993
38.853 bln
-1.318 bln
-3.28%
jan 1, 1994
45.364 bln
+6.511 bln
16.76%
jan 1, 1995
58.883 bln
+13.519 bln
29.8%
jan 1, 1996
74.153 bln
+15.269 bln
25.93%
jan 1, 1997
82.581 bln
+8.429 bln
11.37%
jan 1, 1998
82.318 bln
-263.161 mln
-0.32%
jan 1, 1999
58.799 bln
-23.519 bln
-28.57%
jan 1, 2000
70.92 bln
+12.121 bln
20.61%
jan 1, 2001
139.495 bln
+68.575 bln
96.69%
jan 1, 2002
108.025 bln
-31.47 bln
-22.56%
jan 1, 2003
75.412 bln
-32.613 bln
-30.19%
jan 1, 2004
92.441 bln
+17.029 bln
22.58%
jan 1, 2005
129.173 bln
+36.732 bln
39.74%
jan 1, 2006
100.46 bln
-28.713 bln
-22.23%
jan 1, 2007
206.971 bln
+106.511 bln
106.02%
jan 1, 2008
274.523 bln
+67.552 bln
32.64%
jan 1, 2009
324.909 bln
+50.386 bln
18.35%
jan 1, 2010
257.487 bln
-67.421 bln
-20.75%
jan 1, 2011
361.484 bln
+103.997 bln
40.39%
jan 1, 2012
381.448 bln
+19.964 bln
5.52%
jan 1, 2013
384.143 bln
+2.695 bln
0.71%
jan 1, 2014
437.579 bln
+53.435 bln
13.91%
jan 1, 2015
529.349 bln
+91.771 bln
20.97%
jan 1, 2016
489.667 bln
-39.682 bln
-7.5%
Ranking of countries by current statistics by years


Comments: