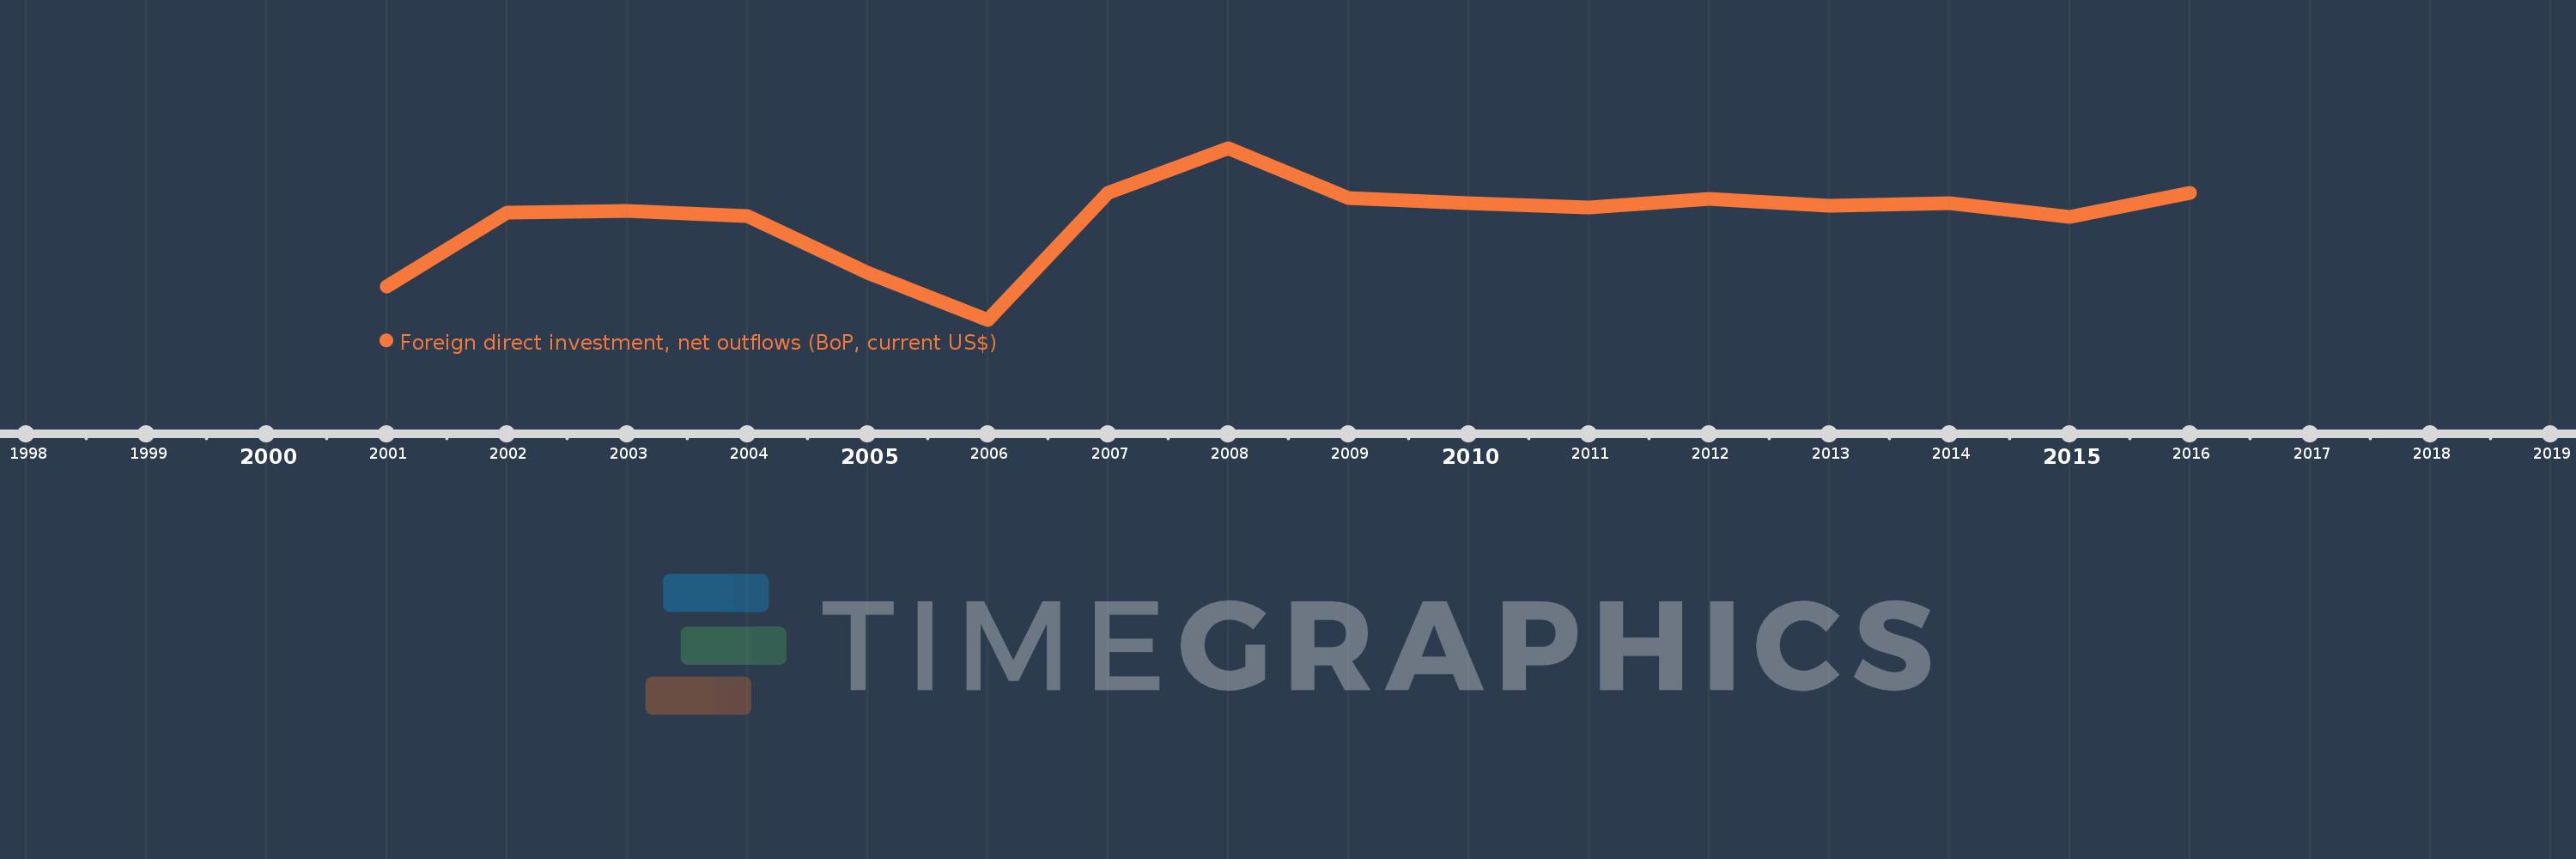
This timeline shows a graph from 2001 to 2016 of Solomon Islands. No data until 2000. Number of actual observations by date: 16.
Source name:
World Development Indicators
Source organization:
International Monetary Fund, Balance of Payments database, supplemented by data from the United Nations Conference on Trade and Development and official national sources.
Categories, topics:
Economy & Growth, Financial Sector
Last updated:
apr 23, 2017
Indicators value changes by year
Meaning:
530.529K
Minimum:
-16.456 mln
jan 1, 2006
Maximum:
12.185 mln
jan 1, 2008
At the date of observation
Value
Absolute change
Change from the previous value
jan 1, 2001
-10.965 mln
-10.965 mln
0.0%
jan 1, 2002
1.425 mln
+12.39 mln
-113.0%
jan 1, 2003
1.714 mln
+288.119K
20.21%
jan 1, 2004
818.582K
-894.998K
-52.23%
jan 1, 2005
-8.672 mln
-9.491 mln
-1.16K%
jan 1, 2006
-16.456 mln
-7.784 mln
89.76%
jan 1, 2007
4.742 mln
+21.198 mln
-128.82%
jan 1, 2008
12.185 mln
+7.443 mln
156.94%
jan 1, 2009
3.775 mln
-8.41 mln
-69.02%
jan 1, 2010
2.984 mln
-790.872K
-20.95%
jan 1, 2011
2.291 mln
-692.251K
-23.2%
jan 1, 2012
3.692 mln
+1.401 mln
61.12%
jan 1, 2013
2.541 mln
-1.151 mln
-31.17%
jan 1, 2014
3.027 mln
+485.432K
19.1%
jan 1, 2015
673.085K
-2.354 mln
-77.76%
jan 1, 2016
4.714 mln
+4.041 mln
600.34%
Ranking of countries by current statistics by years
