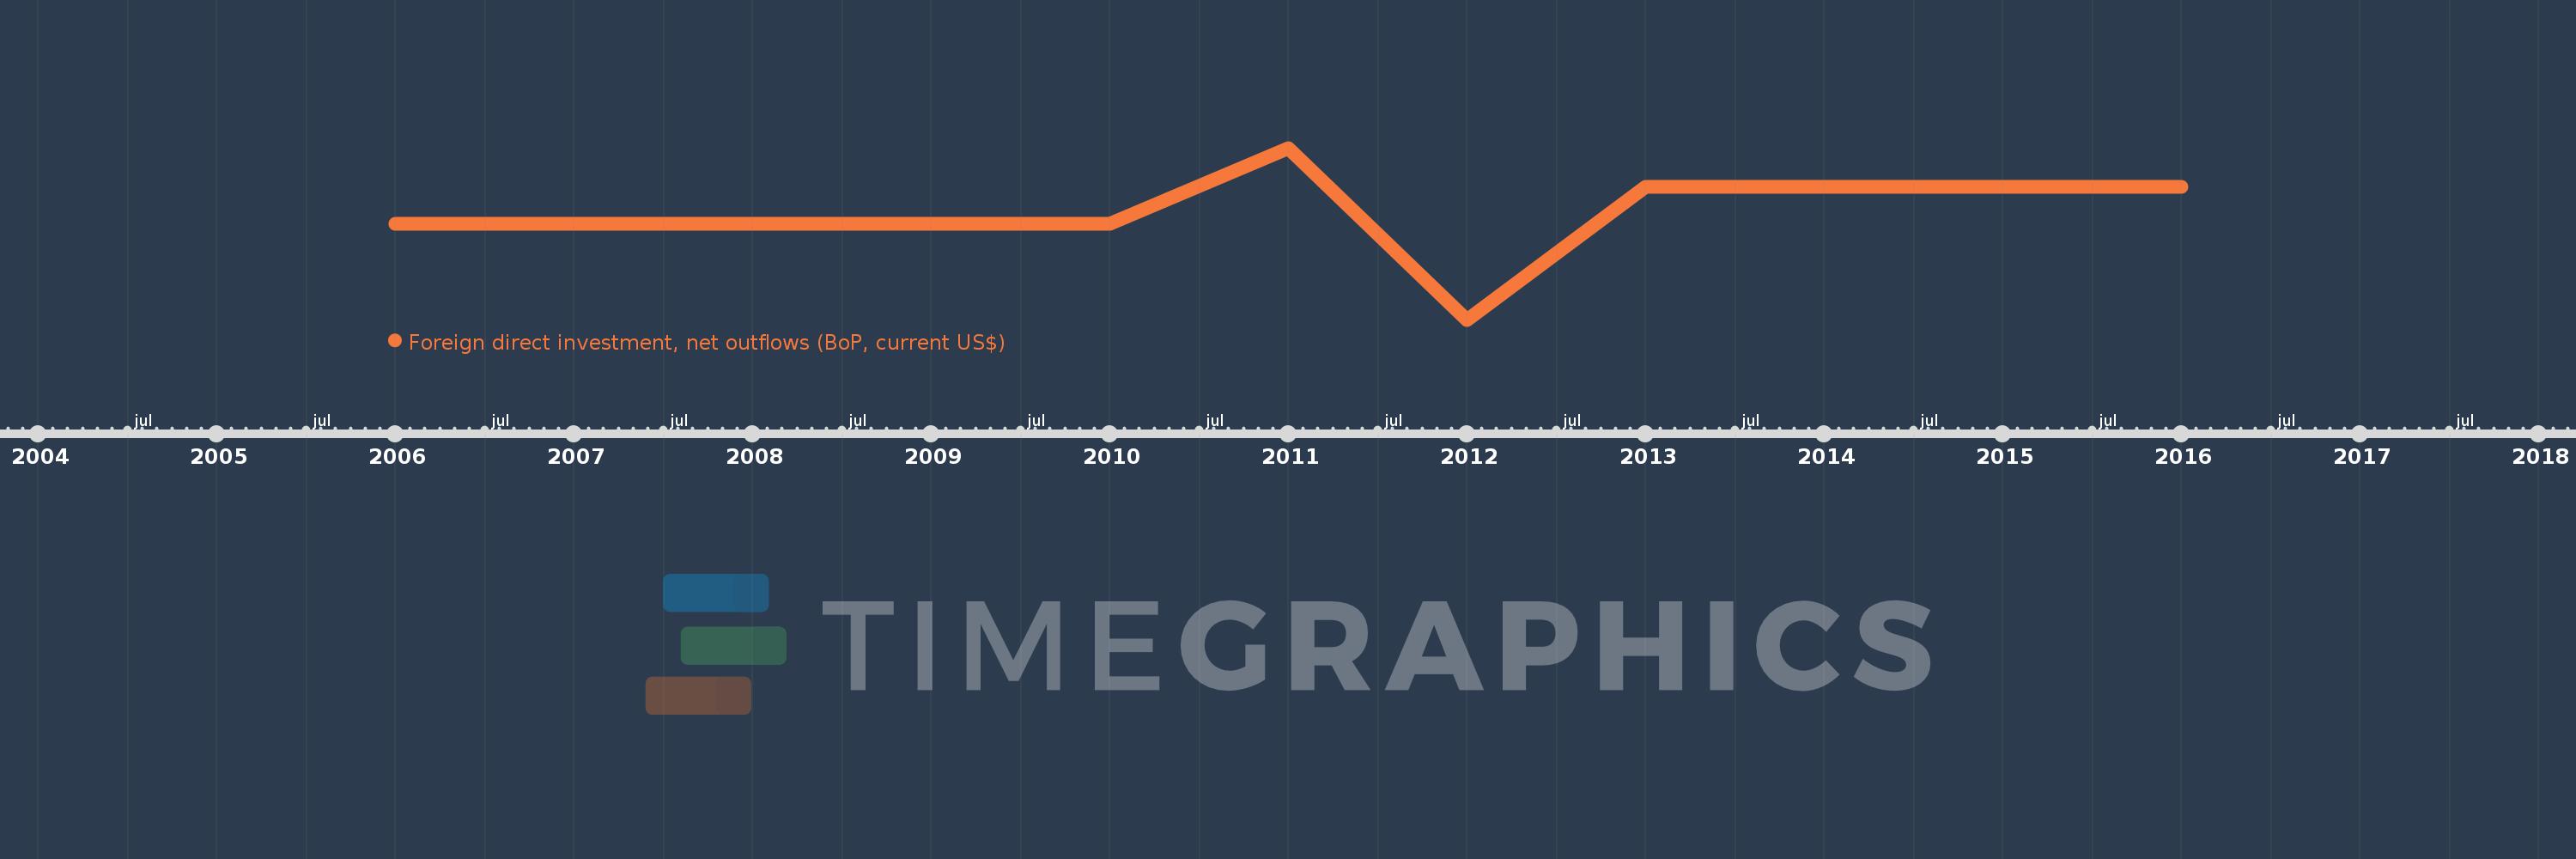
This timeline shows a graph from 2006 to 2016 of Timor-Leste. No data until 2005. Number of actual observations by date: 11.
Source name:
World Development Indicators
Source organization:
International Monetary Fund, Balance of Payments database, supplemented by data from the United Nations Conference on Trade and Development and official national sources.
Categories, topics:
Economy & Growth, Financial Sector
Last updated:
apr 23, 2017
Indicators value changes by year
Meaning:
3.97 mln
Minimum:
-33.0 mln
jan 1, 2012
Maximum:
26.0 mln
jan 1, 2011
At the date of observation
Value
Absolute change
Change from the previous value
jan 1, 2006
0.0
0.0
0.0%
jan 1, 2007
0.0
0.0
%
jan 1, 2008
0.0
0.0
%
jan 1, 2009
0.0
0.0
%
jan 1, 2010
0.0
0.0
%
jan 1, 2011
26.0 mln
+26.0 mln
%
jan 1, 2012
-33.0 mln
-59.0 mln
-226.92%
jan 1, 2013
12.667 mln
+45.667 mln
-138.38%
jan 1, 2014
12.667 mln
0.0
0.0%
jan 1, 2015
12.667 mln
0.0
0.0%
jan 1, 2016
12.667 mln
0.0
0.0%
Ranking of countries by current statistics by years
