29
/
en
AIzaSyAYiBZKx7MnpbEhh9jyipgxe19OcubqV5w
April 1, 2024
255159
Swaziland
SWZ
true
2
1
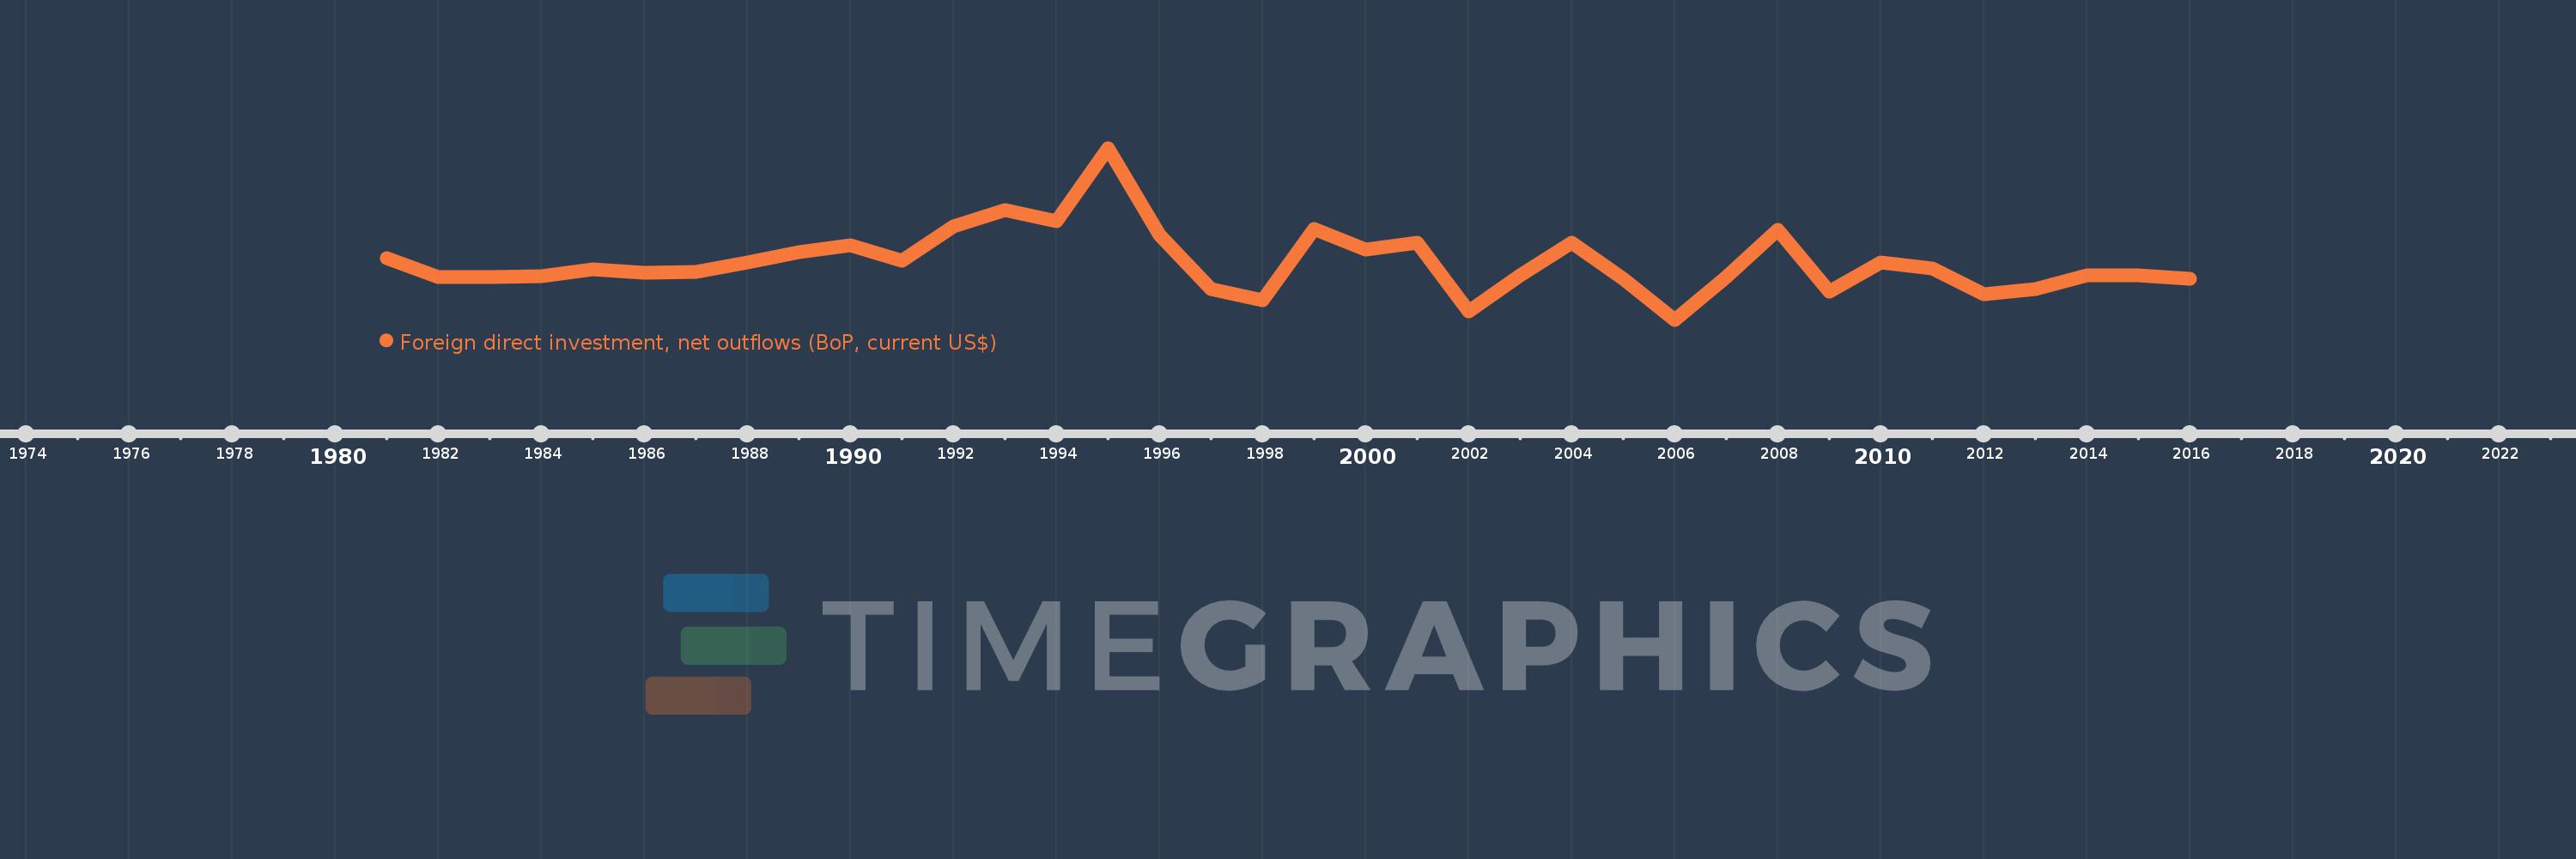
Foreign direct investment, net outflows (BoP, current US$)
2016,2015,2014,2013,2012,2011,2010,2009,2008,2007,2006,2005,2004,2003,2002,2001,2000,1999,1998,1997,1996,1995,1994,1993,1992,1991,1990,1989,1988,1987,1986,1985,1984,1983,1982,1981
This statistics in other country:
AfghanistanAlbaniaAlgeriaAngolaAntigua and BarbudaArab WorldArgentinaArmeniaArubaAustraliaAustriaAzerbaijanBahamas, TheBahrainBangladeshBarbadosBelarusBelgiumBelizeBeninBermudaBoliviaBosnia and HerzegovinaBotswanaBrazilBritish Virgin IslandsBrunei DarussalamBulgariaBurkina FasoBurundiCabo VerdeCambodiaCameroonCanadaCaribbean small statesCayman IslandsCentral African RepublicCentral Europe and the BalticsChadChileChinaColombiaComorosCongo, Dem. Rep.Congo, Rep.Costa RicaCote d'IvoireCroatiaCuracaoCyprusCzech RepublicDenmarkDominicaDominican RepublicEarly-demographic dividendEast Asia & PacificEast Asia & Pacific (excluding high income)East Asia & Pacific (IDA & IBRD countries)EcuadorEgypt, Arab Rep.El SalvadorEquatorial GuineaEritreaEstoniaEuro areaEurope & Central AsiaEurope & Central Asia (excluding high income)Europe & Central Asia (IDA & IBRD countries)European UnionFijiFinlandFragile and conflict affected situationsFranceFrench PolynesiaGabonGambia, TheGeorgiaGermanyGhanaGreeceGrenadaGuatemalaGuineaGuinea-BissauGuyanaHaitiHeavily indebted poor countries (HIPC)High incomeHondurasHong Kong SAR, ChinaHungaryIBRD onlyIcelandIDA & IBRD totalIDA blendIDA onlyIDA totalIndiaIndonesiaIran, Islamic Rep.IraqIrelandIsraelItalyJamaicaJapanJordanKazakhstanKenyaKiribatiKorea, Dem. People’s Rep.Korea, Rep.KosovoKuwaitKyrgyz RepublicLao PDRLate-demographic dividendLatin America & Caribbean Latin America & Caribbean (excluding high income)Latin America & the Caribbean (IDA & IBRD countries)LatviaLeast developed countries: UN classificationLebanonLesothoLiberiaLibyaLithuaniaLow & middle incomeLow incomeLower middle incomeLuxembourgMacao SAR, ChinaMacedonia, FYRMadagascarMalawiMalaysiaMaliMaltaMarshall IslandsMauritaniaMauritiusMexicoMicronesia, Fed. Sts.Middle East & North AfricaMiddle East & North Africa (excluding high income)Middle East & North Africa (IDA & IBRD countries)Middle incomeMoldovaMongoliaMontenegroMoroccoMozambiqueNamibiaNauruNetherlandsNew CaledoniaNew ZealandNicaraguaNigerNigeriaNorth AmericaNorthern Mariana IslandsNorwayOECD membersOmanOther small statesPacific island small statesPakistanPalauPanamaPapua New GuineaParaguayPeruPhilippinesPolandPortugalPost-demographic dividendPre-demographic dividendQatarRomaniaRussian FederationRwandaSamoaSao Tome and PrincipeSaudi ArabiaSenegalSerbiaSeychellesSierra LeoneSingaporeSint Maarten (Dutch part)Slovak RepublicSloveniaSmall statesSolomon IslandsSouth AfricaSouth AsiaSouth Asia (IDA & IBRD)SpainSri LankaSt. Kitts and NevisSt. LuciaSt. Vincent and the GrenadinesSub-Saharan Africa Sub-Saharan Africa (excluding high income)Sub-Saharan Africa (IDA & IBRD countries)SurinameSwazilandSwedenSwitzerlandSyrian Arab RepublicTajikistanTanzaniaThailandTimor-LesteTogoTongaTrinidad and TobagoTunisiaTurkeyUgandaUkraineUnited Arab EmiratesUnited KingdomUnited StatesUpper middle incomeUruguayVanuatuVenezuela, RBVietnamWest Bank and GazaWorldYemen, Rep.ZambiaZimbabwe Timeline:
This timeline shows a graph from 1981 to 2016 of Swaziland. No data until 1980. Number of actual observations by date: 36.
Source name:
World Development Indicators
Source organization:
International Monetary Fund, Balance of Payments database, supplemented by data from the United Nations Conference on Trade and Development and official national sources.
Categories, topics:
Economy & Growth, Financial Sector
Last updated:
apr 23, 2017
Indicators value changes by year
Minimum:
-22.029 mln
jan 1, 2006
Maximum:
64.692 mln
jan 1, 1995
At the date of observation
Value
Absolute change
Change from previous value
jan 1, 1981
8.988 mln
+8.988 mln
0.0%
jan 1, 1982
-570.488K
-9.559 mln
-106.35%
jan 1, 1983
-276.29K
+294.198K
-51.57%
jan 1, 1984
89.759K
+366.048K
-132.49%
jan 1, 1985
3.254 mln
+3.164 mln
3.52K%
jan 1, 1986
1.709 mln
-1.544 mln
-47.46%
jan 1, 1987
2.276 mln
+566.213K
33.12%
jan 1, 1988
6.68 mln
+4.404 mln
193.52%
jan 1, 1989
12.272 mln
+5.592 mln
83.72%
jan 1, 1990
15.633 mln
+3.361 mln
27.39%
jan 1, 1991
7.614 mln
-8.019 mln
-51.29%
jan 1, 1992
25.024 mln
+17.41 mln
228.66%
jan 1, 1993
33.17 mln
+8.145 mln
32.55%
jan 1, 1994
27.781 mln
-5.389 mln
-16.25%
jan 1, 1995
64.692 mln
+36.911 mln
132.86%
jan 1, 1996
20.594 mln
-44.097 mln
-68.17%
jan 1, 1997
-6.447 mln
-27.041 mln
-131.3%
jan 1, 1998
-11.987 mln
-5.54 mln
85.94%
jan 1, 1999
23.919 mln
+35.906 mln
-299.54%
jan 1, 2000
13.239 mln
-10.68 mln
-44.65%
jan 1, 2001
17.074 mln
+3.836 mln
28.97%
jan 1, 2002
-17.699 mln
-34.773 mln
-203.66%
jan 1, 2003
326.827K
+18.025 mln
-101.85%
jan 1, 2004
17.073 mln
+16.746 mln
5.12K%
jan 1, 2005
-1.447 mln
-18.52 mln
-108.47%
jan 1, 2006
-22.029 mln
-20.583 mln
1.42K%
jan 1, 2007
-614.586K
+21.415 mln
-97.21%
jan 1, 2008
23.165 mln
+23.779 mln
-3.87K%
jan 1, 2009
-7.941 mln
-31.106 mln
-134.28%
jan 1, 2010
7.016 mln
+14.957 mln
-188.36%
jan 1, 2011
3.906 mln
-3.11 mln
-44.32%
jan 1, 2012
-9.007 mln
-12.913 mln
-330.56%
jan 1, 2013
-6.397 mln
+2.61 mln
-28.98%
jan 1, 2014
321.433K
+6.718 mln
-105.03%
jan 1, 2015
516.03K
+194.597K
60.54%
jan 1, 2016
-1.222 mln
-1.738 mln
-336.71%
Ranking of countries by current statistics by years


Comments: