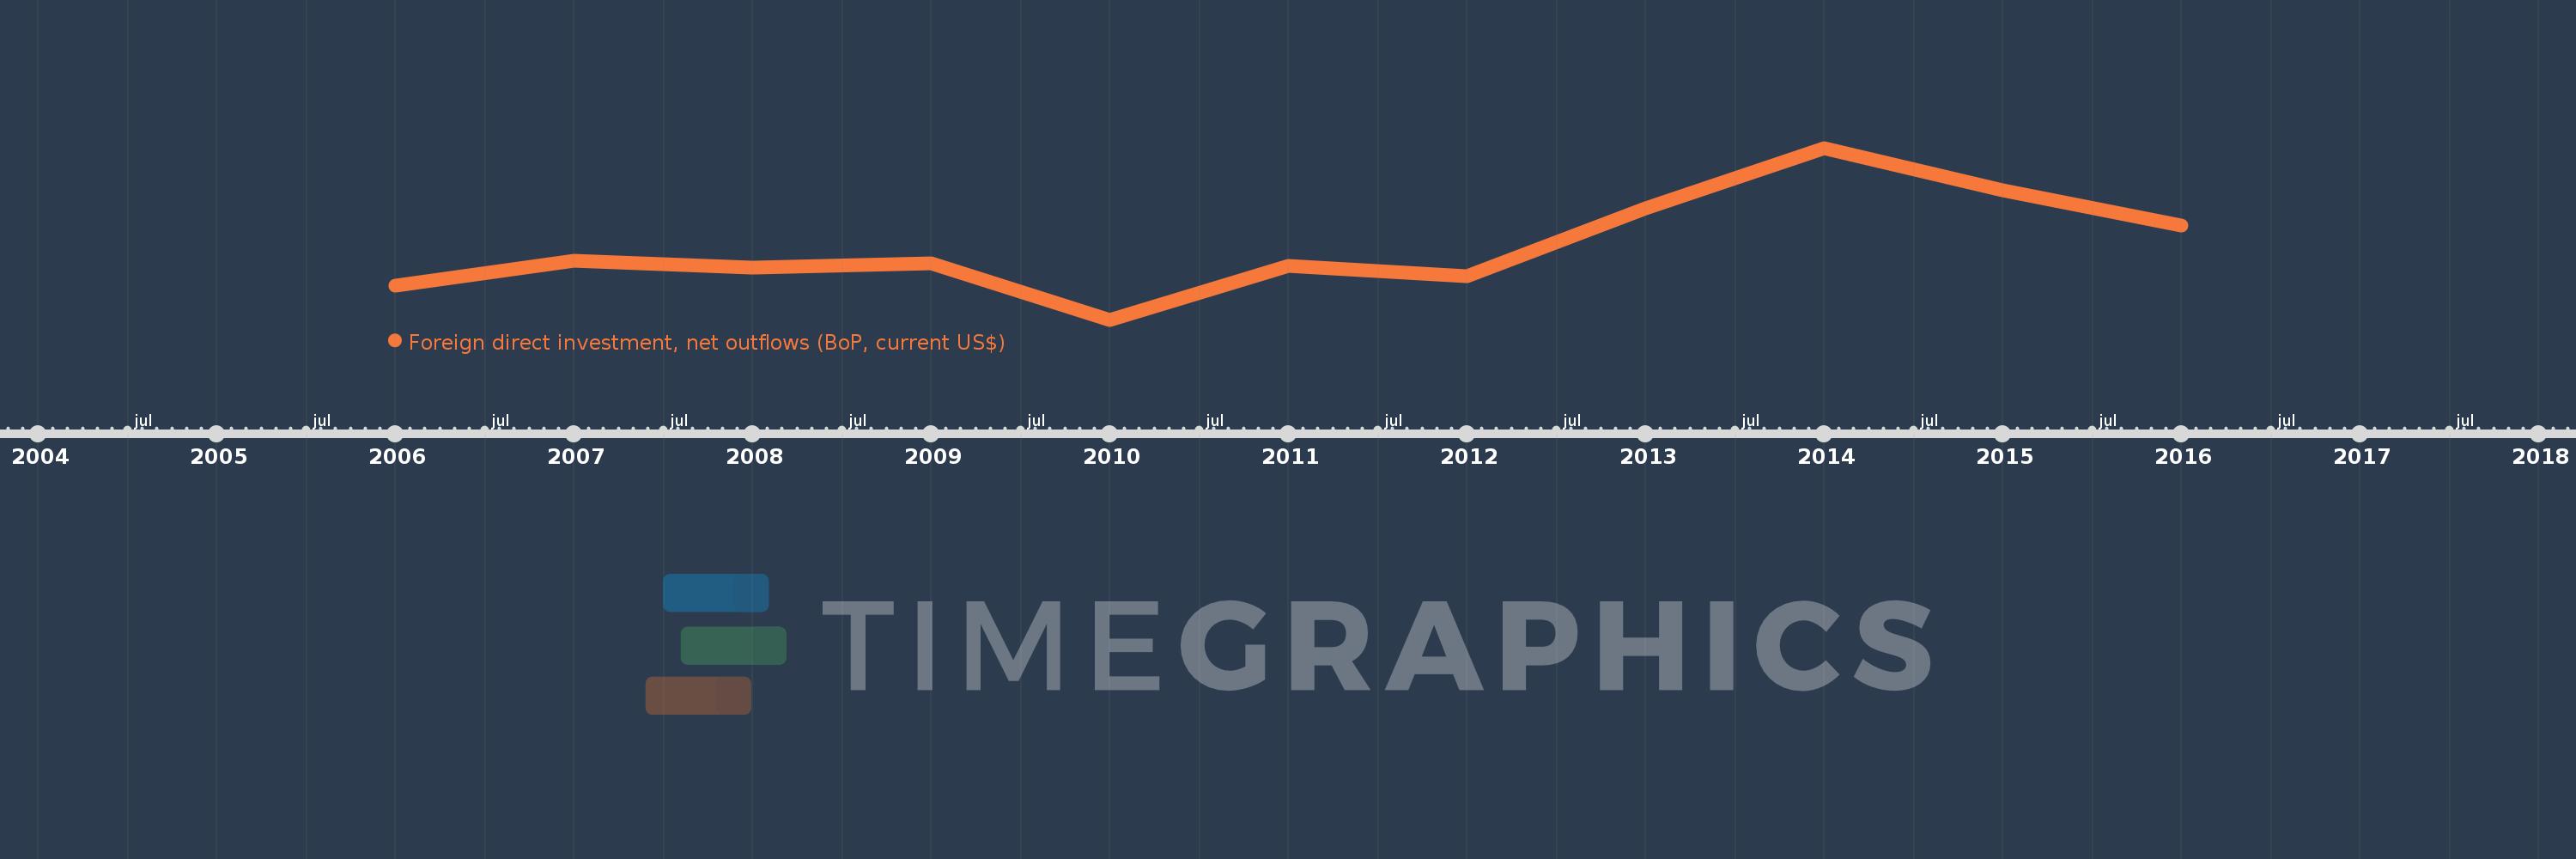
This timeline shows a graph from 2006 to 2016 of Nicaragua. No data until 2005. Number of actual observations by date: 11.
Source name:
World Development Indicators
Source organization:
International Monetary Fund, Balance of Payments database, supplemented by data from the United Nations Conference on Trade and Development and official national sources.
Categories, topics:
Economy & Growth, Financial Sector
Last updated:
apr 23, 2017
Indicators value changes by year
Meaning:
32.845 mln
Minimum:
-29.1 mln
jan 1, 2010
Maximum:
116.0 mln
jan 1, 2014
At the date of observation
Value
Absolute change
Change from the previous value
jan 1, 2006
0.0
0.0
0.0%
jan 1, 2007
21.0 mln
+21.0 mln
%
jan 1, 2008
15.3 mln
-5.7 mln
-27.14%
jan 1, 2009
18.9 mln
+3.6 mln
23.53%
jan 1, 2010
-29.1 mln
-48.0 mln
-253.97%
jan 1, 2011
16.4 mln
+45.5 mln
-156.36%
jan 1, 2012
7.7 mln
-8.7 mln
-53.05%
jan 1, 2013
64.7 mln
+57.0 mln
740.26%
jan 1, 2014
116.0 mln
+51.3 mln
79.29%
jan 1, 2015
79.9 mln
-36.1 mln
-31.12%
jan 1, 2016
50.5 mln
-29.4 mln
-36.8%
Ranking of countries by current statistics by years
