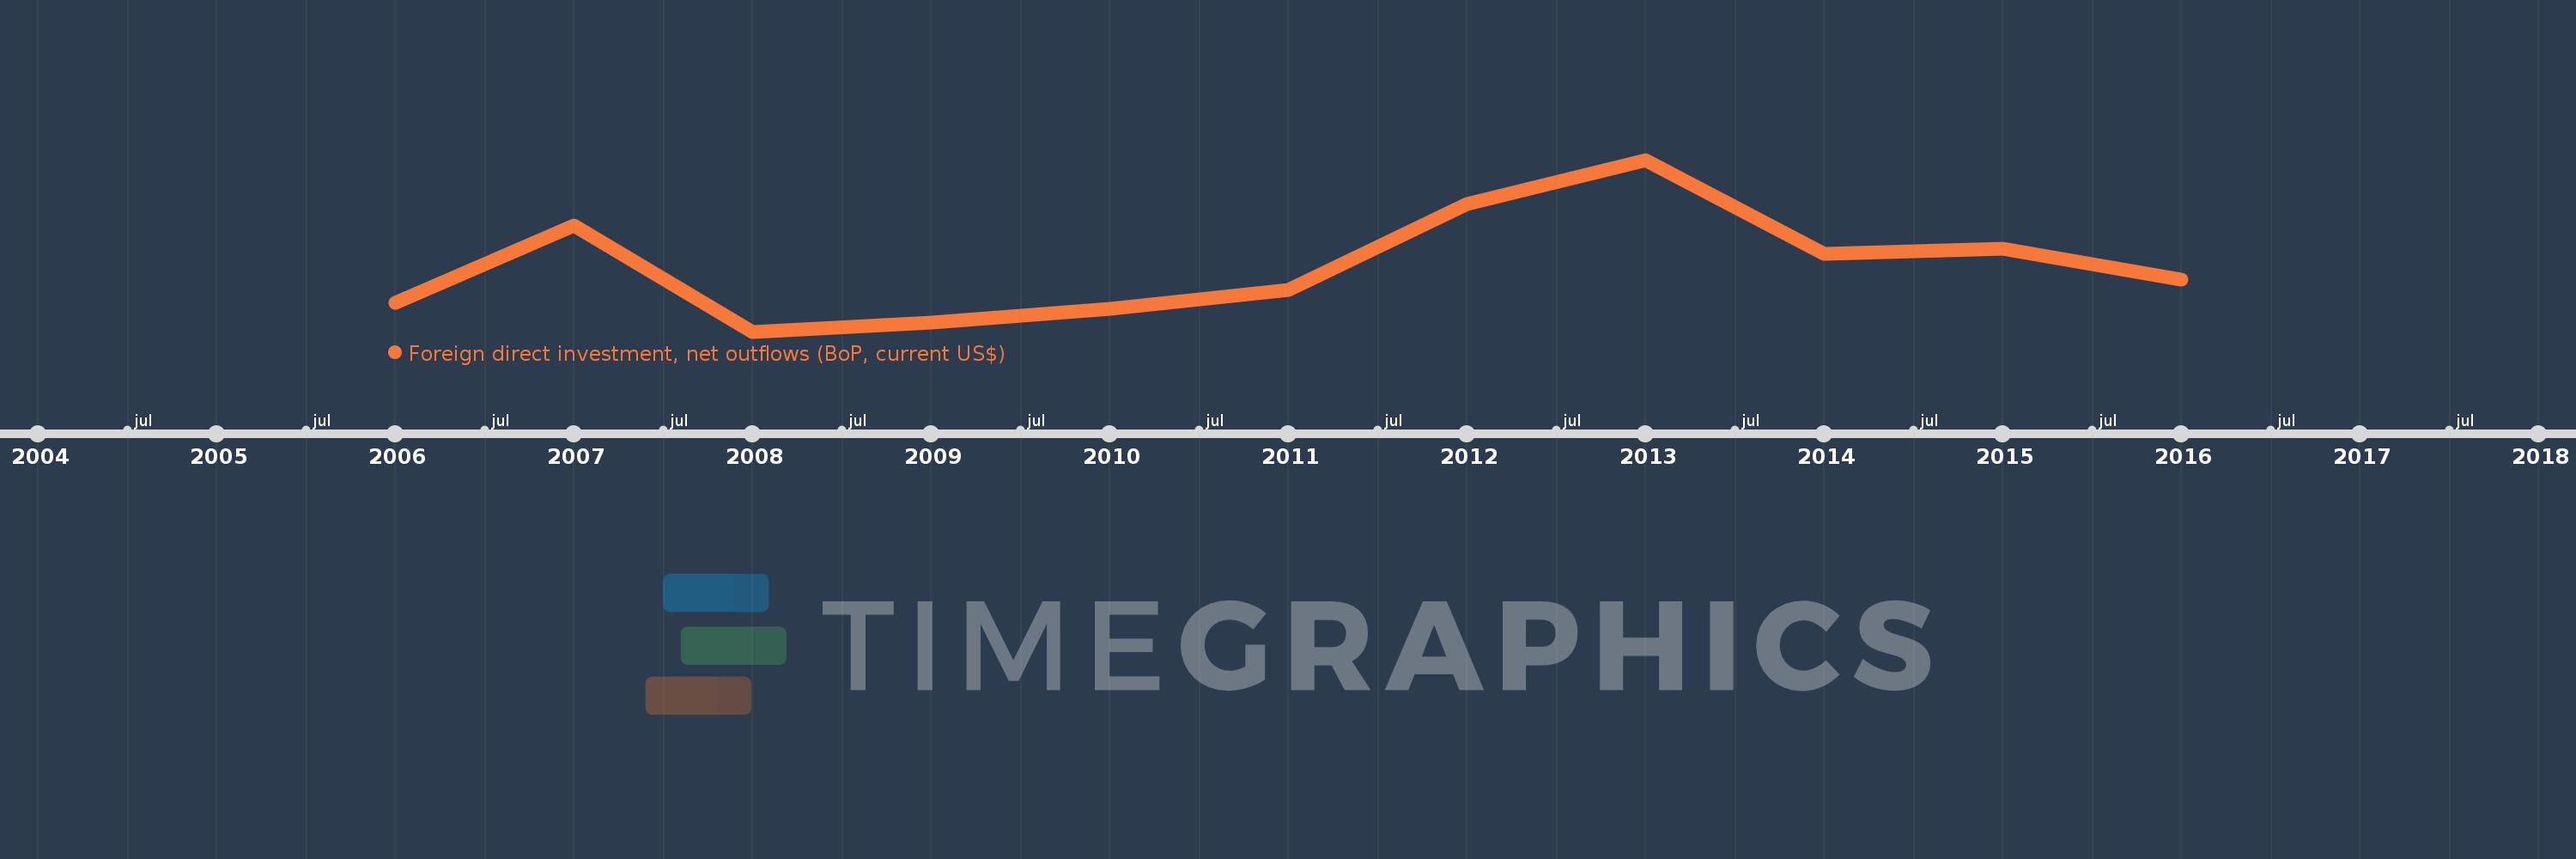
This timeline shows a graph from 2006 to 2016 of Iraq. No data until 2005. Number of actual observations by date: 11.
Source name:
World Development Indicators
Source organization:
International Monetary Fund, Balance of Payments database, supplemented by data from the United Nations Conference on Trade and Development and official national sources.
Categories, topics:
Economy & Growth, Financial Sector
Last updated:
apr 23, 2017
Indicators value changes by year
Meaning:
191.739 mln
Minimum:
7.9 mln
jan 1, 2008
Maximum:
490.0 mln
jan 1, 2013
At the date of observation
Value
Absolute change
Change from the previous value
jan 1, 2006
88.7 mln
+88.7 mln
0.0%
jan 1, 2007
305.0 mln
+216.3 mln
243.86%
jan 1, 2008
7.9 mln
-297.1 mln
-97.41%
jan 1, 2009
33.6 mln
+25.7 mln
325.32%
jan 1, 2010
71.9 mln
+38.3 mln
113.99%
jan 1, 2011
124.9 mln
+53.0 mln
73.71%
jan 1, 2012
366.0 mln
+241.1 mln
193.03%
jan 1, 2013
490.0 mln
+124.0 mln
33.88%
jan 1, 2014
227.1 mln
-262.9 mln
-53.65%
jan 1, 2015
241.5 mln
+14.4 mln
6.34%
jan 1, 2016
152.533 mln
-88.967 mln
-36.84%
Ranking of countries by current statistics by years
