29
/
en
AIzaSyAYiBZKx7MnpbEhh9jyipgxe19OcubqV5w
April 1, 2024
63021
World
WLD
false
2
1
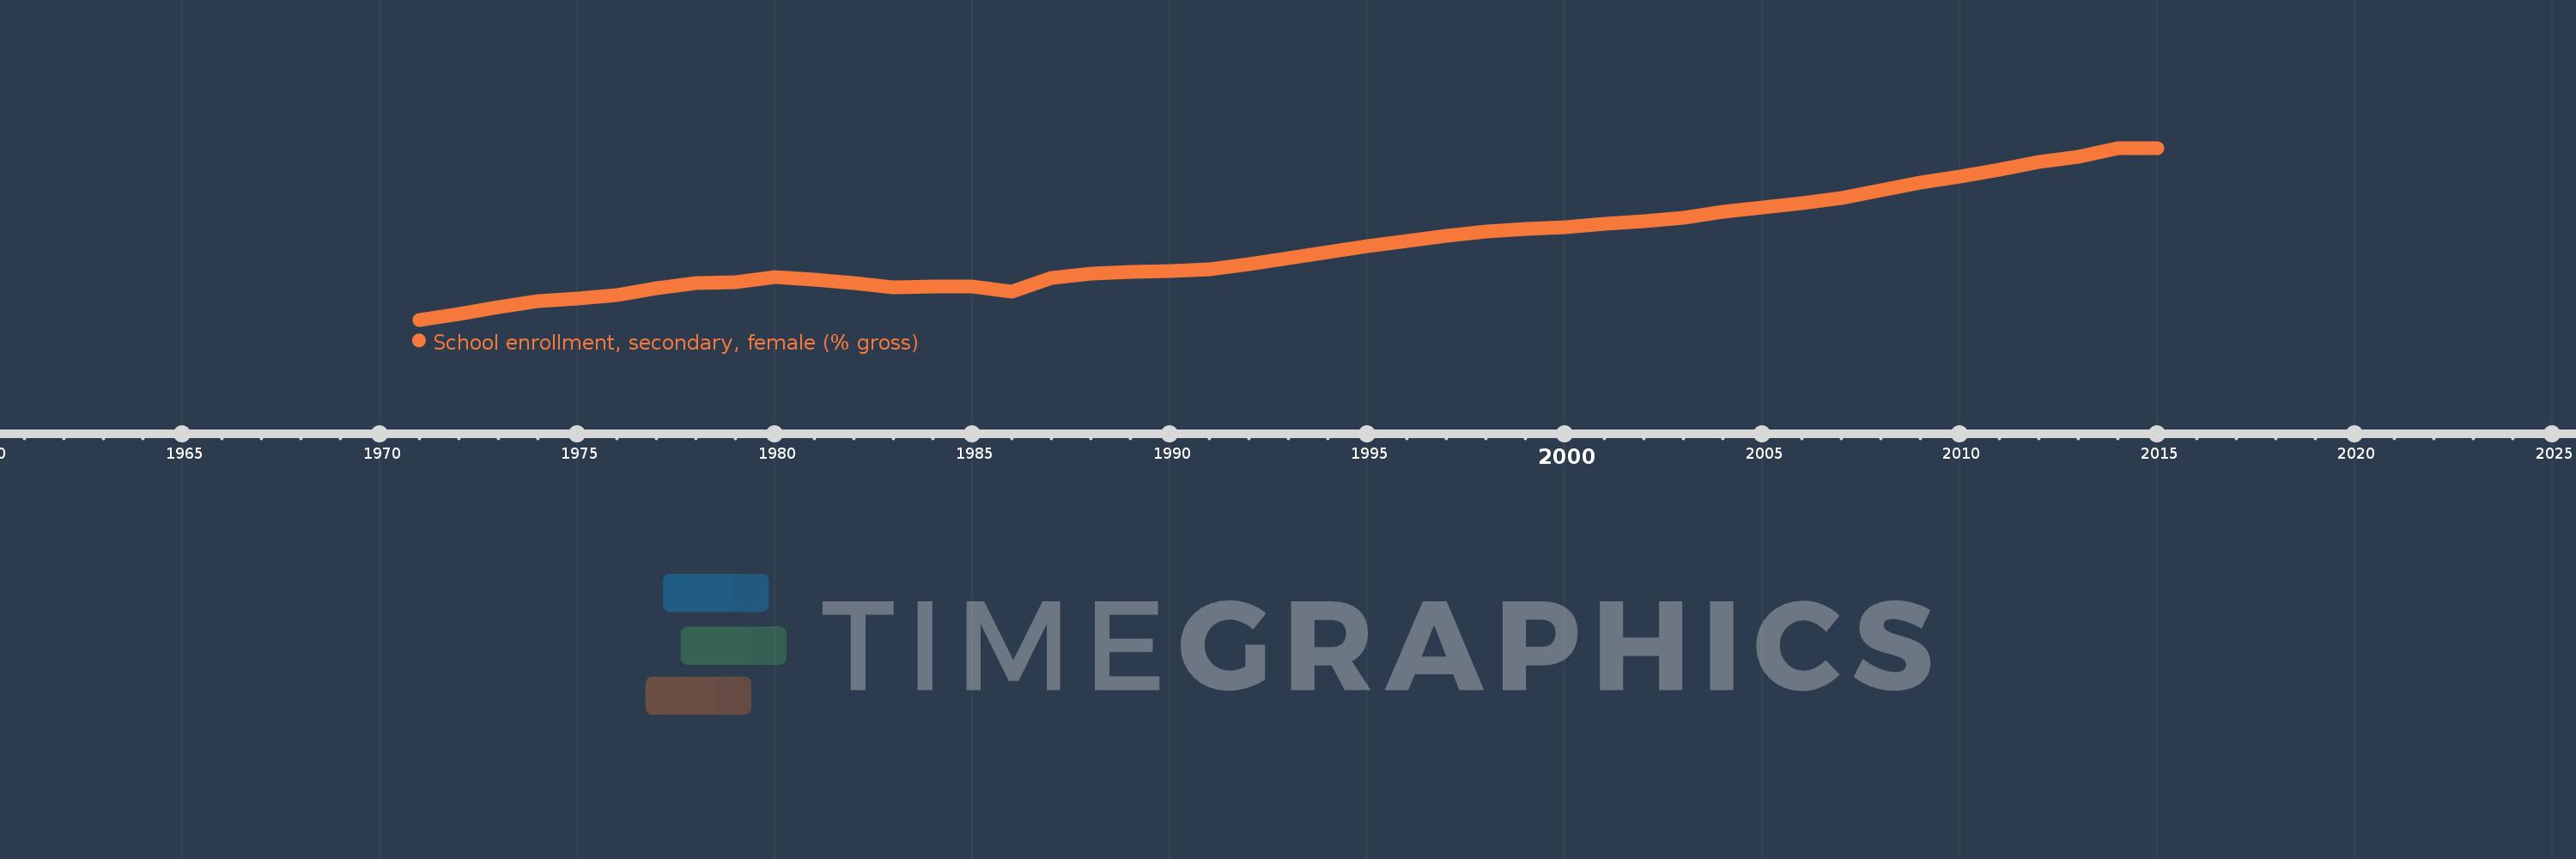
School enrollment, secondary, female (% gross)
2015,2014,2013,2012,2011,2010,2009,2008,2007,2006,2005,2004,2003,2002,2001,2000,1999,1998,1997,1996,1995,1994,1993,1992,1991,1990,1989,1988,1987,1986,1985,1984,1983,1982,1981,1980,1979,1978,1977,1976,1975,1974,1973,1972,1971
This statistics in other country:
AfghanistanAlbaniaAlgeriaAndorraAngolaAntigua and BarbudaArab WorldArgentinaArmeniaArubaAustraliaAustriaAzerbaijanBahamas, TheBahrainBangladeshBarbadosBelarusBelgiumBelizeBeninBermudaBhutanBoliviaBosnia and HerzegovinaBotswanaBrazilBrunei DarussalamBulgariaBurkina FasoBurundiCabo VerdeCambodiaCameroonCanadaCaribbean small statesCentral African RepublicCentral Europe and the BalticsChadChileChinaColombiaComorosCongo, Dem. Rep.Congo, Rep.Costa RicaCote d'IvoireCroatiaCubaCuracaoCyprusCzech RepublicDenmarkDjiboutiDominicaDominican RepublicEarly-demographic dividendEast Asia & PacificEast Asia & Pacific (excluding high income)East Asia & Pacific (IDA & IBRD countries)EcuadorEgypt, Arab Rep.El SalvadorEquatorial GuineaEritreaEstoniaEthiopiaEuro areaEurope & Central AsiaEurope & Central Asia (excluding high income)Europe & Central Asia (IDA & IBRD countries)European UnionFijiFinlandFragile and conflict affected situationsFranceGabonGambia, TheGeorgiaGermanyGhanaGreeceGrenadaGuatemalaGuineaGuinea-BissauGuyanaHeavily indebted poor countries (HIPC)High incomeHondurasHong Kong SAR, ChinaHungaryIBRD onlyIcelandIDA & IBRD totalIDA blendIDA onlyIDA totalIndiaIndonesiaIran, Islamic Rep.IraqIrelandIsraelItalyJamaicaJapanJordanKazakhstanKenyaKiribatiKorea, Dem. People’s Rep.Korea, Rep.KuwaitKyrgyz RepublicLao PDRLate-demographic dividendLatin America & Caribbean Latin America & Caribbean (excluding high income)Latin America & the Caribbean (IDA & IBRD countries)LatviaLeast developed countries: UN classificationLebanonLesothoLiberiaLibyaLiechtensteinLithuaniaLow & middle incomeLow incomeLower middle incomeLuxembourgMacao SAR, ChinaMacedonia, FYRMadagascarMalawiMaldivesMaliMaltaMarshall IslandsMauritaniaMauritiusMexicoMicronesia, Fed. Sts.Middle East & North AfricaMiddle East & North Africa (excluding high income)Middle East & North Africa (IDA & IBRD countries)Middle incomeMoldovaMongoliaMontenegroMoroccoMozambiqueMyanmarNamibiaNauruNepalNetherlandsNew ZealandNicaraguaNigerNigeriaNorth AmericaNorwayOECD membersOmanOther small statesPacific island small statesPakistanPalauPanamaPapua New GuineaParaguayPeruPhilippinesPolandPortugalPost-demographic dividendPre-demographic dividendPuerto RicoQatarRomaniaRussian FederationRwandaSamoaSan MarinoSao Tome and PrincipeSaudi ArabiaSenegalSerbiaSeychellesSierra LeoneSlovak RepublicSloveniaSmall statesSolomon IslandsSomaliaSouth AfricaSouth AsiaSouth Asia (IDA & IBRD)SpainSri LankaSt. Kitts and NevisSt. LuciaSt. Vincent and the GrenadinesSub-Saharan Africa Sub-Saharan Africa (excluding high income)Sub-Saharan Africa (IDA & IBRD countries)SudanSurinameSwazilandSwedenSwitzerlandSyrian Arab RepublicTajikistanTanzaniaThailandTimor-LesteTogoTongaTrinidad and TobagoTunisiaTurkeyTurkmenistanTuvaluUgandaUkraineUnited Arab EmiratesUnited KingdomUnited StatesUpper middle incomeUruguayUzbekistanVanuatuVenezuela, RBVietnamWest Bank and GazaWorldYemen, Rep.ZambiaZimbabwe Timeline:
This timeline shows a graph from 1971 to 2015 of World. No data until 1970. Number of actual observations by date: 45.
Source name:
World Development Indicators
Source organization:
United Nations Educational, Scientific, and Cultural Organization (UNESCO) Institute for Statistics.
Categories, topics:
Education, Gender
Last updated:
apr 23, 2017
Indicators value changes by year
Minimum:
35.679
jan 1, 1971
Maximum:
74.532
jan 1, 2014
At the date of observation
Value
Absolute change
Change from previous value
jan 1, 1971
35.679
+35.679
0.0%
jan 1, 1972
36.97
+1.291
3.62%
jan 1, 1973
38.486
+1.516
4.1%
jan 1, 1974
39.972
+1.486
3.86%
jan 1, 1975
40.508
+0.536
1.34%
jan 1, 1976
41.292
+0.784
1.94%
jan 1, 1977
42.85
+1.558
3.77%
jan 1, 1978
43.943
+1.093
2.55%
jan 1, 1979
44.259
+0.316
0.72%
jan 1, 1980
45.397
+1.137
2.57%
jan 1, 1981
44.74
-0.656
-1.45%
jan 1, 1982
43.891
-0.85
-1.9%
jan 1, 1983
43.037
-0.853
-1.94%
jan 1, 1984
43.246
+0.209
0.48%
jan 1, 1985
43.26
+0.015
0.03%
jan 1, 1986
42.048
-1.213
-2.8%
jan 1, 1987
45.121
+3.073
7.31%
jan 1, 1988
46.086
+0.966
2.14%
jan 1, 1989
46.5
+0.413
0.9%
jan 1, 1990
46.672
+0.173
0.37%
jan 1, 1991
47.043
+0.371
0.79%
jan 1, 1992
48.2
+1.157
2.46%
jan 1, 1993
49.591
+1.391
2.89%
jan 1, 1994
51.008
+1.417
2.86%
jan 1, 1995
52.261
+1.253
2.46%
jan 1, 1996
53.454
+1.194
2.28%
jan 1, 1997
54.571
+1.117
2.09%
jan 1, 1998
55.668
+1.097
2.01%
jan 1, 1999
56.263
+0.594
1.07%
jan 1, 2000
56.696
+0.434
0.77%
jan 1, 2001
57.442
+0.745
1.31%
jan 1, 2002
57.895
+0.453
0.79%
jan 1, 2003
58.788
+0.894
1.54%
jan 1, 2004
60.195
+1.406
2.39%
jan 1, 2005
61.007
+0.812
1.35%
jan 1, 2006
62.06
+1.054
1.73%
jan 1, 2007
63.116
+1.056
1.7%
jan 1, 2008
64.88
+1.764
2.79%
jan 1, 2009
66.701
+1.821
2.81%
jan 1, 2010
67.972
+1.271
1.91%
jan 1, 2011
69.658
+1.686
2.48%
jan 1, 2012
71.294
+1.636
2.35%
jan 1, 2013
72.618
+1.324
1.86%
jan 1, 2014
74.532
+1.914
2.64%
jan 1, 2015
74.519
-0.012
-0.02%
Ranking of countries by current statistics by years


Comments: