29
/
en
AIzaSyAYiBZKx7MnpbEhh9jyipgxe19OcubqV5w
April 1, 2024
256805
Sweden
SWE
true
2
1
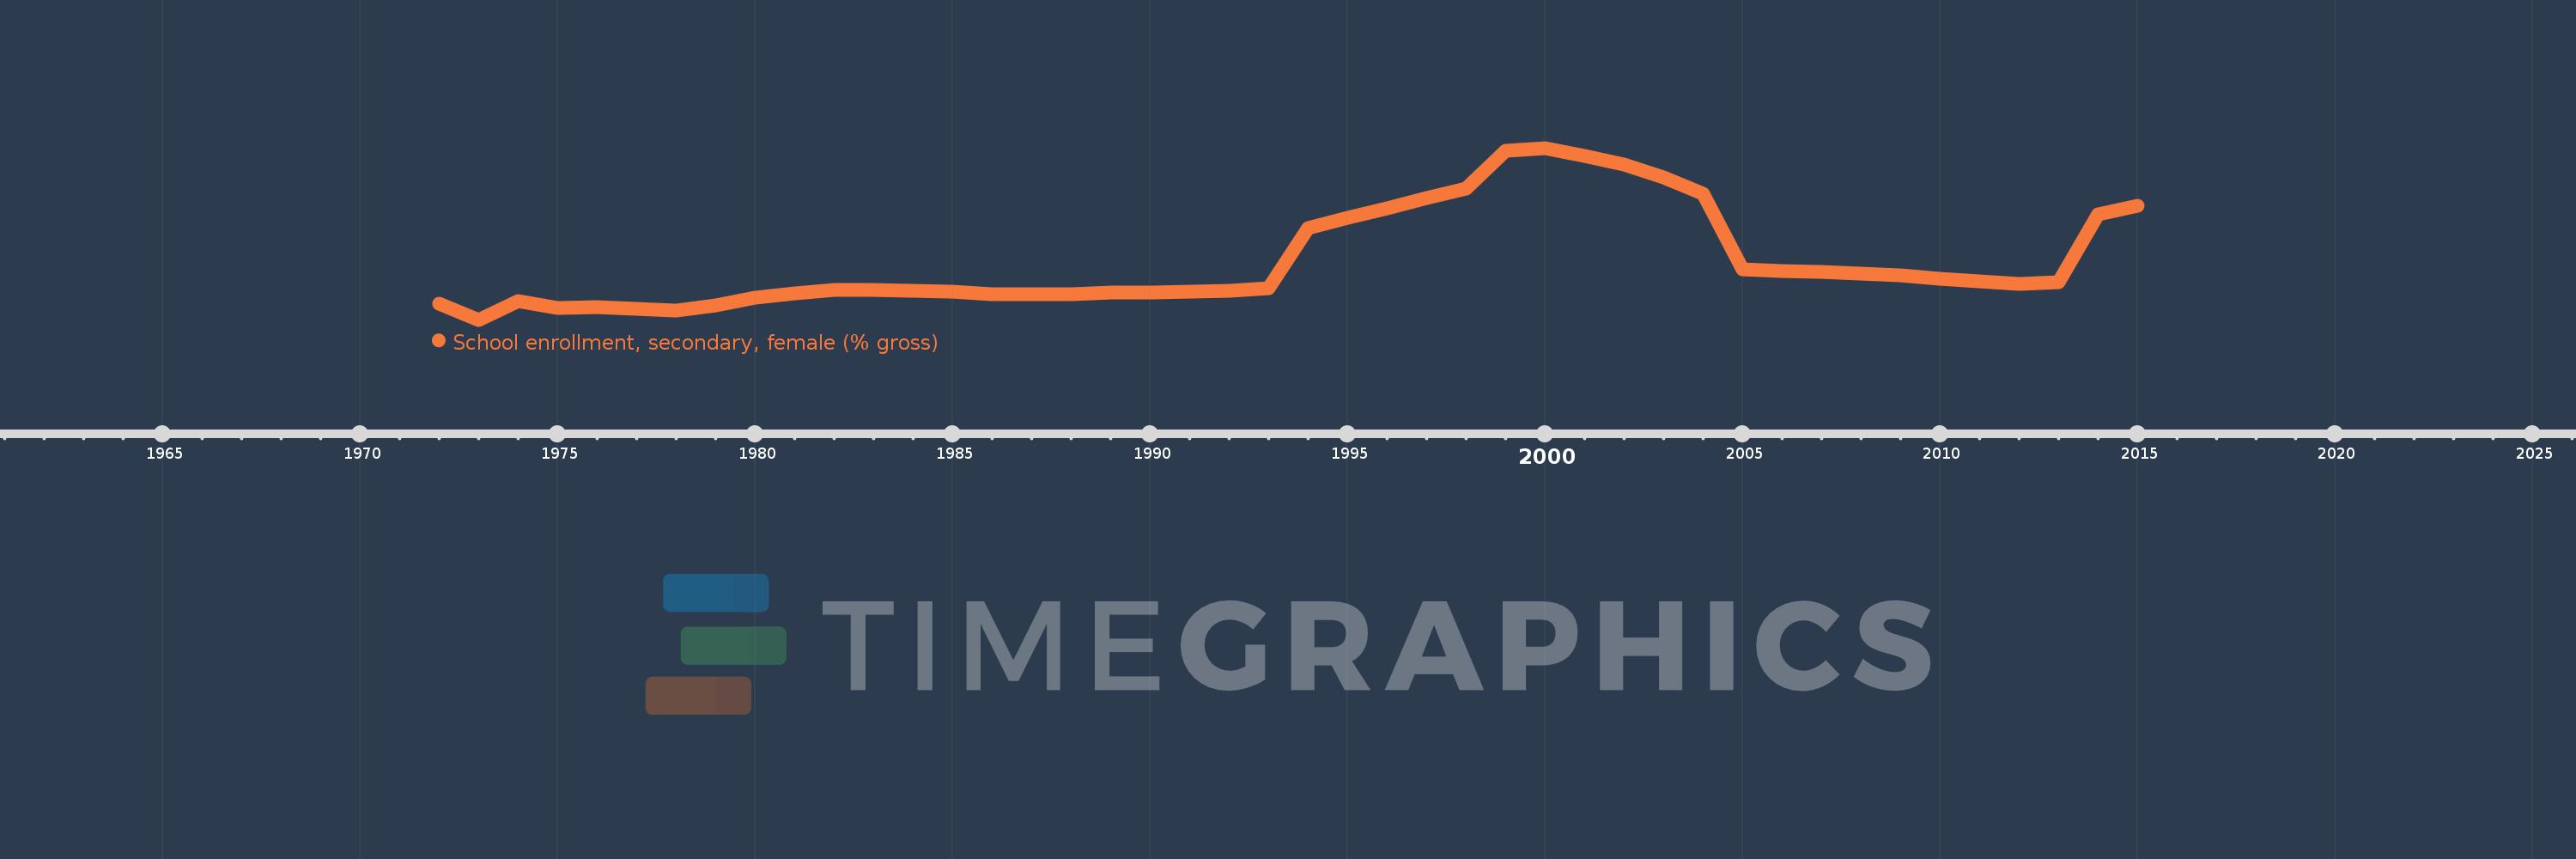
School enrollment, secondary, female (% gross)
2015,2014,2013,2012,2011,2010,2009,2008,2007,2006,2005,2004,2003,2002,2001,2000,1999,1998,1997,1996,1995,1994,1993,1992,1991,1990,1989,1988,1986,1985,1984,1983,1982,1981,1980,1979,1978,1977,1976,1975,1974,1973,1972
This statistics in other country:
AfghanistanAlbaniaAlgeriaAndorraAngolaAntigua and BarbudaArab WorldArgentinaArmeniaArubaAustraliaAustriaAzerbaijanBahamas, TheBahrainBangladeshBarbadosBelarusBelgiumBelizeBeninBermudaBhutanBoliviaBosnia and HerzegovinaBotswanaBrazilBrunei DarussalamBulgariaBurkina FasoBurundiCabo VerdeCambodiaCameroonCanadaCaribbean small statesCentral African RepublicCentral Europe and the BalticsChadChileChinaColombiaComorosCongo, Dem. Rep.Congo, Rep.Costa RicaCote d'IvoireCroatiaCubaCuracaoCyprusCzech RepublicDenmarkDjiboutiDominicaDominican RepublicEarly-demographic dividendEast Asia & PacificEast Asia & Pacific (excluding high income)East Asia & Pacific (IDA & IBRD countries)EcuadorEgypt, Arab Rep.El SalvadorEquatorial GuineaEritreaEstoniaEthiopiaEuro areaEurope & Central AsiaEurope & Central Asia (excluding high income)Europe & Central Asia (IDA & IBRD countries)European UnionFijiFinlandFragile and conflict affected situationsFranceGabonGambia, TheGeorgiaGermanyGhanaGreeceGrenadaGuatemalaGuineaGuinea-BissauGuyanaHeavily indebted poor countries (HIPC)High incomeHondurasHong Kong SAR, ChinaHungaryIBRD onlyIcelandIDA & IBRD totalIDA blendIDA onlyIDA totalIndiaIndonesiaIran, Islamic Rep.IraqIrelandIsraelItalyJamaicaJapanJordanKazakhstanKenyaKiribatiKorea, Dem. People’s Rep.Korea, Rep.KuwaitKyrgyz RepublicLao PDRLate-demographic dividendLatin America & Caribbean Latin America & Caribbean (excluding high income)Latin America & the Caribbean (IDA & IBRD countries)LatviaLeast developed countries: UN classificationLebanonLesothoLiberiaLibyaLiechtensteinLithuaniaLow & middle incomeLow incomeLower middle incomeLuxembourgMacao SAR, ChinaMacedonia, FYRMadagascarMalawiMaldivesMaliMaltaMarshall IslandsMauritaniaMauritiusMexicoMicronesia, Fed. Sts.Middle East & North AfricaMiddle East & North Africa (excluding high income)Middle East & North Africa (IDA & IBRD countries)Middle incomeMoldovaMongoliaMontenegroMoroccoMozambiqueMyanmarNamibiaNauruNepalNetherlandsNew ZealandNicaraguaNigerNigeriaNorth AmericaNorwayOECD membersOmanOther small statesPacific island small statesPakistanPalauPanamaPapua New GuineaParaguayPeruPhilippinesPolandPortugalPost-demographic dividendPre-demographic dividendPuerto RicoQatarRomaniaRussian FederationRwandaSamoaSan MarinoSao Tome and PrincipeSaudi ArabiaSenegalSerbiaSeychellesSierra LeoneSlovak RepublicSloveniaSmall statesSolomon IslandsSomaliaSouth AfricaSouth AsiaSouth Asia (IDA & IBRD)SpainSri LankaSt. Kitts and NevisSt. LuciaSt. Vincent and the GrenadinesSub-Saharan Africa Sub-Saharan Africa (excluding high income)Sub-Saharan Africa (IDA & IBRD countries)SudanSurinameSwazilandSwedenSwitzerlandSyrian Arab RepublicTajikistanTanzaniaThailandTimor-LesteTogoTongaTrinidad and TobagoTunisiaTurkeyTurkmenistanTuvaluUgandaUkraineUnited Arab EmiratesUnited KingdomUnited StatesUpper middle incomeUruguayUzbekistanVanuatuVenezuela, RBVietnamWest Bank and GazaWorldYemen, Rep.ZambiaZimbabwe Timeline:
This timeline shows a graph from 1972 to 2015 of Sweden. No data until 1971. Number of actual observations by date: 43.
Source name:
World Development Indicators
Source organization:
United Nations Educational, Scientific, and Cultural Organization (UNESCO) Institute for Statistics.
Categories, topics:
Education, Gender
Last updated:
apr 23, 2017
Indicators value changes by year
Minimum:
75.472
jan 1, 1973
Maximum:
175.267
jan 1, 2000
At the date of observation
Value
Absolute change
Change from previous value
jan 1, 1972
84.929
+84.929
0.0%
jan 1, 1973
75.472
-9.456
-11.13%
jan 1, 1974
86.328
+10.856
14.38%
jan 1, 1975
82.516
-3.812
-4.42%
jan 1, 1976
82.572
+0.056
0.07%
jan 1, 1977
81.774
-0.797
-0.97%
jan 1, 1978
81.0
-0.774
-0.95%
jan 1, 1979
83.755
+2.754
3.4%
jan 1, 1980
88.29
+4.535
5.41%
jan 1, 1981
90.871
+2.581
2.92%
jan 1, 1982
92.635
+1.764
1.94%
jan 1, 1983
92.656
+0.021
0.02%
jan 1, 1984
92.166
-0.489
-0.53%
jan 1, 1985
91.671
-0.495
-0.54%
jan 1, 1986
90.375
-1.297
-1.41%
jan 1, 1988
90.467
+0.092
0.1%
jan 1, 1989
91.231
+0.764
0.84%
jan 1, 1990
91.529
+0.298
0.33%
jan 1, 1991
91.749
+0.22
0.24%
jan 1, 1992
92.284
+0.536
0.58%
jan 1, 1993
93.677
+1.393
1.51%
jan 1, 1994
128.824
+35.147
37.52%
jan 1, 1995
134.842
+6.018
4.67%
jan 1, 1996
140.227
+5.385
3.99%
jan 1, 1997
146.348
+6.121
4.37%
jan 1, 1998
151.855
+5.507
3.76%
jan 1, 1999
173.784
+21.929
14.44%
jan 1, 2000
175.267
+1.484
0.85%
jan 1, 2001
170.53
-4.737
-2.7%
jan 1, 2002
165.392
-5.138
-3.01%
jan 1, 2003
158.285
-7.106
-4.3%
jan 1, 2004
148.868
-9.418
-5.95%
jan 1, 2005
104.988
-43.879
-29.48%
jan 1, 2006
103.872
-1.117
-1.06%
jan 1, 2007
103.385
-0.486
-0.47%
jan 1, 2008
102.259
-1.127
-1.09%
jan 1, 2009
101.255
-1.004
-0.98%
jan 1, 2010
99.288
-1.967
-1.94%
jan 1, 2011
97.664
-1.624
-1.64%
jan 1, 2012
96.393
-1.271
-1.3%
jan 1, 2013
97.36
+0.967
1.0%
jan 1, 2014
136.755
+39.395
40.46%
jan 1, 2015
141.596
+4.841
3.54%
Ranking of countries by current statistics by years


Comments: