29
/
en
AIzaSyAYiBZKx7MnpbEhh9jyipgxe19OcubqV5w
April 1, 2024
215785
Oman
OMN
true
2
1
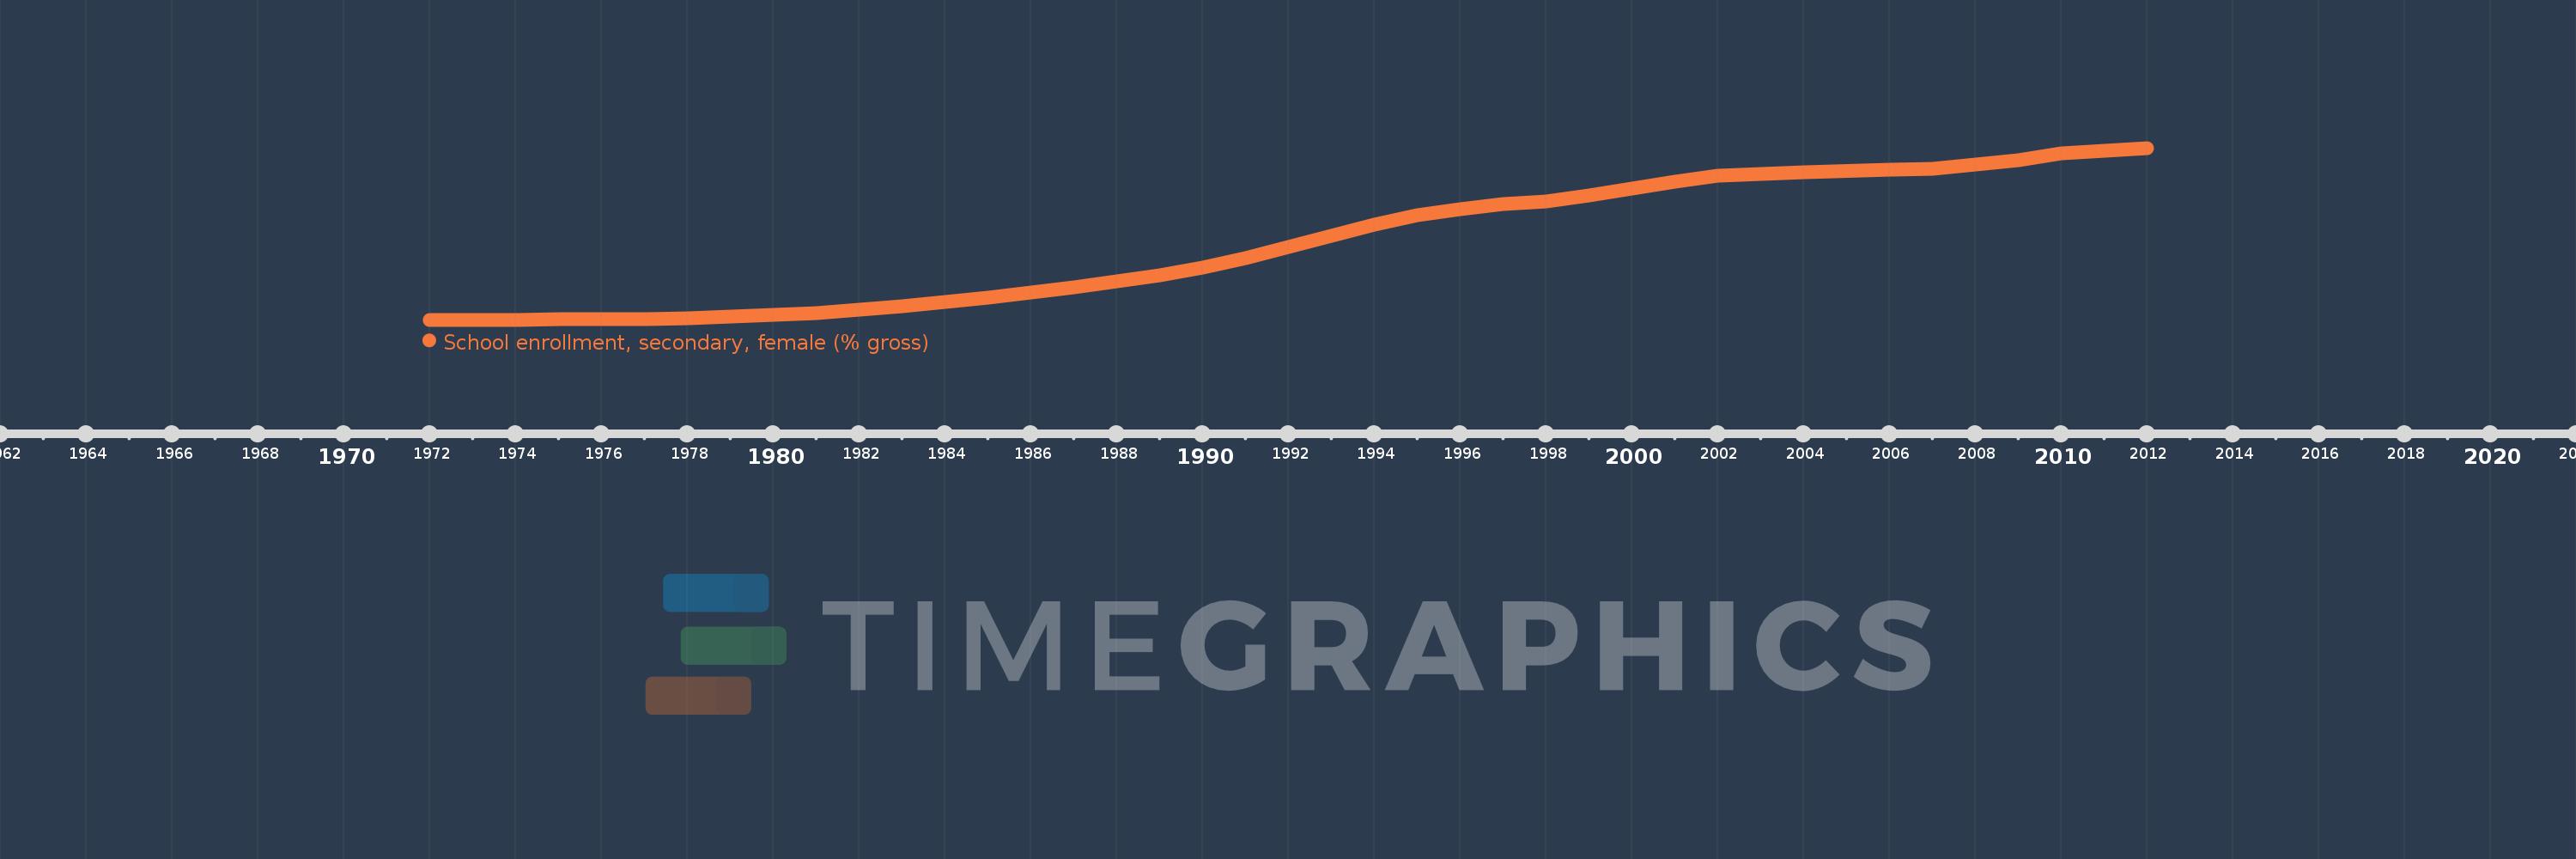
School enrollment, secondary, female (% gross)
2012,2010,2009,2008,2007,2006,2004,2003,2002,2001,2000,1999,1998,1997,1996,1995,1994,1993,1992,1991,1990,1989,1988,1987,1986,1985,1984,1983,1982,1981,1980,1979,1978,1977,1976,1975,1974,1973,1972
This statistics in other country:
AfghanistanAlbaniaAlgeriaAndorraAngolaAntigua and BarbudaArab WorldArgentinaArmeniaArubaAustraliaAustriaAzerbaijanBahamas, TheBahrainBangladeshBarbadosBelarusBelgiumBelizeBeninBermudaBhutanBoliviaBosnia and HerzegovinaBotswanaBrazilBrunei DarussalamBulgariaBurkina FasoBurundiCabo VerdeCambodiaCameroonCanadaCaribbean small statesCentral African RepublicCentral Europe and the BalticsChadChileChinaColombiaComorosCongo, Dem. Rep.Congo, Rep.Costa RicaCote d'IvoireCroatiaCubaCuracaoCyprusCzech RepublicDenmarkDjiboutiDominicaDominican RepublicEarly-demographic dividendEast Asia & PacificEast Asia & Pacific (excluding high income)East Asia & Pacific (IDA & IBRD countries)EcuadorEgypt, Arab Rep.El SalvadorEquatorial GuineaEritreaEstoniaEthiopiaEuro areaEurope & Central AsiaEurope & Central Asia (excluding high income)Europe & Central Asia (IDA & IBRD countries)European UnionFijiFinlandFragile and conflict affected situationsFranceGabonGambia, TheGeorgiaGermanyGhanaGreeceGrenadaGuatemalaGuineaGuinea-BissauGuyanaHeavily indebted poor countries (HIPC)High incomeHondurasHong Kong SAR, ChinaHungaryIBRD onlyIcelandIDA & IBRD totalIDA blendIDA onlyIDA totalIndiaIndonesiaIran, Islamic Rep.IraqIrelandIsraelItalyJamaicaJapanJordanKazakhstanKenyaKiribatiKorea, Dem. People’s Rep.Korea, Rep.KuwaitKyrgyz RepublicLao PDRLate-demographic dividendLatin America & Caribbean Latin America & Caribbean (excluding high income)Latin America & the Caribbean (IDA & IBRD countries)LatviaLeast developed countries: UN classificationLebanonLesothoLiberiaLibyaLiechtensteinLithuaniaLow & middle incomeLow incomeLower middle incomeLuxembourgMacao SAR, ChinaMacedonia, FYRMadagascarMalawiMaldivesMaliMaltaMarshall IslandsMauritaniaMauritiusMexicoMicronesia, Fed. Sts.Middle East & North AfricaMiddle East & North Africa (excluding high income)Middle East & North Africa (IDA & IBRD countries)Middle incomeMoldovaMongoliaMontenegroMoroccoMozambiqueMyanmarNamibiaNauruNepalNetherlandsNew ZealandNicaraguaNigerNigeriaNorth AmericaNorwayOECD membersOmanOther small statesPacific island small statesPakistanPalauPanamaPapua New GuineaParaguayPeruPhilippinesPolandPortugalPost-demographic dividendPre-demographic dividendPuerto RicoQatarRomaniaRussian FederationRwandaSamoaSan MarinoSao Tome and PrincipeSaudi ArabiaSenegalSerbiaSeychellesSierra LeoneSlovak RepublicSloveniaSmall statesSolomon IslandsSomaliaSouth AfricaSouth AsiaSouth Asia (IDA & IBRD)SpainSri LankaSt. Kitts and NevisSt. LuciaSt. Vincent and the GrenadinesSub-Saharan Africa Sub-Saharan Africa (excluding high income)Sub-Saharan Africa (IDA & IBRD countries)SudanSurinameSwazilandSwedenSwitzerlandSyrian Arab RepublicTajikistanTanzaniaThailandTimor-LesteTogoTongaTrinidad and TobagoTunisiaTurkeyTurkmenistanTuvaluUgandaUkraineUnited Arab EmiratesUnited KingdomUnited StatesUpper middle incomeUruguayUzbekistanVanuatuVenezuela, RBVietnamWest Bank and GazaWorldYemen, Rep.ZambiaZimbabwe Timeline:
This timeline shows a graph from 1972 to 2012 of Oman. No data until 1971. Number of actual observations by date: 39.
Source name:
World Development Indicators
Source organization:
United Nations Educational, Scientific, and Cultural Organization (UNESCO) Institute for Statistics.
Categories, topics:
Education, Gender
Last updated:
apr 23, 2017
Indicators value changes by year
At the date of observation
Value
Absolute change
Change from previous value
jan 1, 1974
0.078
+0.078
%
jan 1, 1975
0.149
+0.07
89.92%
jan 1, 1976
0.277
+0.128
86.17%
jan 1, 1977
0.395
+0.118
42.67%
jan 1, 1978
0.843
+0.448
113.35%
jan 1, 1979
1.651
+0.808
95.92%
jan 1, 1980
2.663
+1.012
61.31%
jan 1, 1981
4.028
+1.365
51.23%
jan 1, 1982
5.846
+1.818
45.14%
jan 1, 1983
7.923
+2.077
35.52%
jan 1, 1984
10.021
+2.098
26.48%
jan 1, 1985
12.438
+2.417
24.12%
jan 1, 1986
15.821
+3.382
27.19%
jan 1, 1987
18.619
+2.798
17.69%
jan 1, 1988
21.878
+3.259
17.5%
jan 1, 1989
25.357
+3.479
15.9%
jan 1, 1990
29.779
+4.423
17.44%
jan 1, 1991
35.18
+5.401
18.14%
jan 1, 1992
41.721
+6.54
18.59%
jan 1, 1993
47.909
+6.188
14.83%
jan 1, 1994
54.262
+6.353
13.26%
jan 1, 1995
60.0
+5.737
10.57%
jan 1, 1996
63.503
+3.503
5.84%
jan 1, 1997
66.136
+2.633
4.15%
jan 1, 1998
67.909
+1.773
2.68%
jan 1, 1999
70.945
+3.036
4.47%
jan 1, 2000
74.844
+3.899
5.5%
jan 1, 2001
78.816
+3.972
5.31%
jan 1, 2002
82.245
+3.429
4.35%
jan 1, 2003
83.663
+1.417
1.72%
jan 1, 2004
84.338
+0.676
0.81%
jan 1, 2006
86.018
+1.68
1.99%
jan 1, 2007
86.555
+0.537
0.62%
jan 1, 2008
88.743
+2.189
2.53%
jan 1, 2009
91.306
+2.562
2.89%
jan 1, 2010
95.315
+4.01
4.39%
jan 1, 2012
98.34
+3.025
3.17%
Ranking of countries by current statistics by years


Comments: