29
/
en
AIzaSyAYiBZKx7MnpbEhh9jyipgxe19OcubqV5w
April 1, 2024
54419
Pacific island small states
PSS
false
2
1
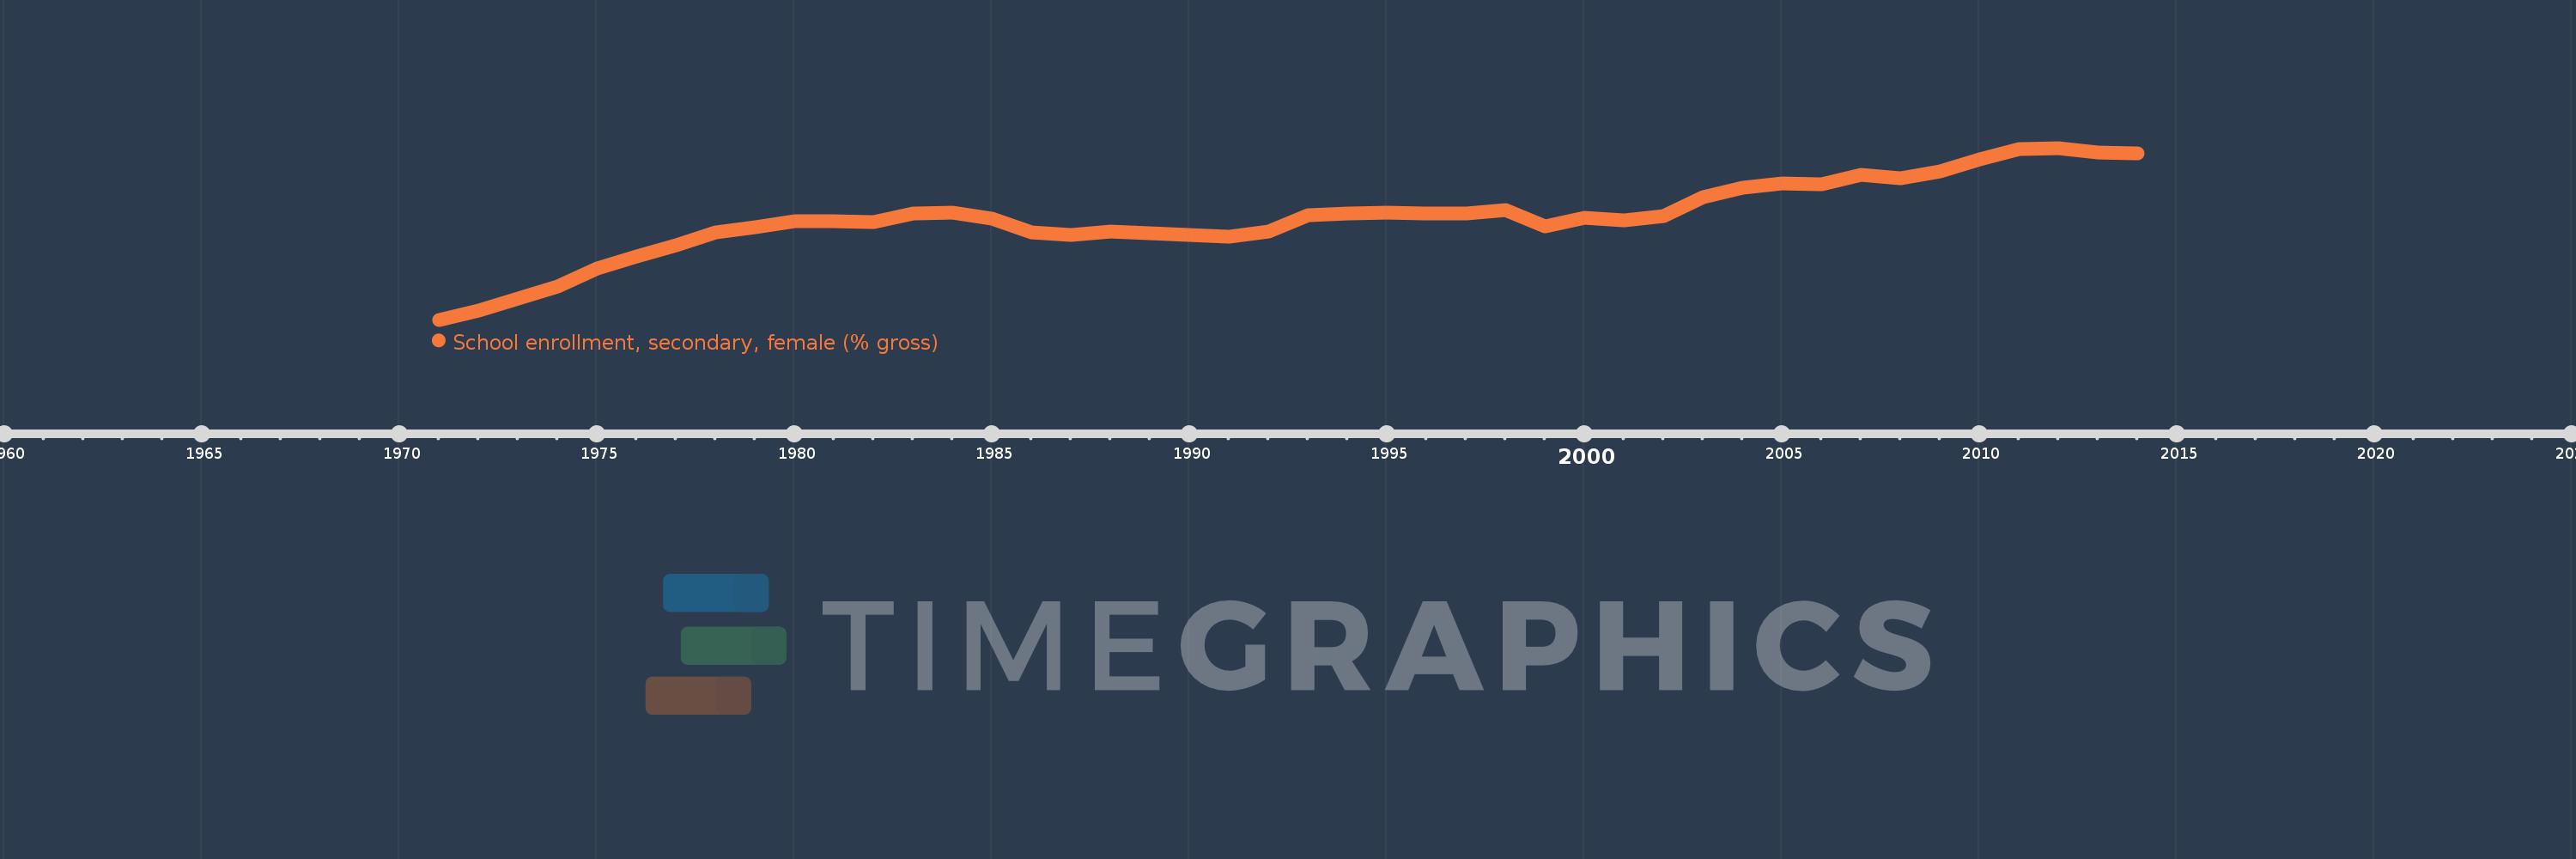
School enrollment, secondary, female (% gross)
2014,2013,2012,2011,2010,2009,2008,2007,2006,2005,2004,2003,2002,2001,2000,1999,1998,1997,1996,1995,1994,1993,1992,1991,1990,1989,1988,1987,1986,1985,1984,1983,1982,1981,1980,1979,1978,1977,1976,1975,1974,1973,1972,1971
This statistics in other country:
AfghanistanAlbaniaAlgeriaAndorraAngolaAntigua and BarbudaArab WorldArgentinaArmeniaArubaAustraliaAustriaAzerbaijanBahamas, TheBahrainBangladeshBarbadosBelarusBelgiumBelizeBeninBermudaBhutanBoliviaBosnia and HerzegovinaBotswanaBrazilBrunei DarussalamBulgariaBurkina FasoBurundiCabo VerdeCambodiaCameroonCanadaCaribbean small statesCentral African RepublicCentral Europe and the BalticsChadChileChinaColombiaComorosCongo, Dem. Rep.Congo, Rep.Costa RicaCote d'IvoireCroatiaCubaCuracaoCyprusCzech RepublicDenmarkDjiboutiDominicaDominican RepublicEarly-demographic dividendEast Asia & PacificEast Asia & Pacific (excluding high income)East Asia & Pacific (IDA & IBRD countries)EcuadorEgypt, Arab Rep.El SalvadorEquatorial GuineaEritreaEstoniaEthiopiaEuro areaEurope & Central AsiaEurope & Central Asia (excluding high income)Europe & Central Asia (IDA & IBRD countries)European UnionFijiFinlandFragile and conflict affected situationsFranceGabonGambia, TheGeorgiaGermanyGhanaGreeceGrenadaGuatemalaGuineaGuinea-BissauGuyanaHeavily indebted poor countries (HIPC)High incomeHondurasHong Kong SAR, ChinaHungaryIBRD onlyIcelandIDA & IBRD totalIDA blendIDA onlyIDA totalIndiaIndonesiaIran, Islamic Rep.IraqIrelandIsraelItalyJamaicaJapanJordanKazakhstanKenyaKiribatiKorea, Dem. People’s Rep.Korea, Rep.KuwaitKyrgyz RepublicLao PDRLate-demographic dividendLatin America & Caribbean Latin America & Caribbean (excluding high income)Latin America & the Caribbean (IDA & IBRD countries)LatviaLeast developed countries: UN classificationLebanonLesothoLiberiaLibyaLiechtensteinLithuaniaLow & middle incomeLow incomeLower middle incomeLuxembourgMacao SAR, ChinaMacedonia, FYRMadagascarMalawiMaldivesMaliMaltaMarshall IslandsMauritaniaMauritiusMexicoMicronesia, Fed. Sts.Middle East & North AfricaMiddle East & North Africa (excluding high income)Middle East & North Africa (IDA & IBRD countries)Middle incomeMoldovaMongoliaMontenegroMoroccoMozambiqueMyanmarNamibiaNauruNepalNetherlandsNew ZealandNicaraguaNigerNigeriaNorth AmericaNorwayOECD membersOmanOther small statesPacific island small statesPakistanPalauPanamaPapua New GuineaParaguayPeruPhilippinesPolandPortugalPost-demographic dividendPre-demographic dividendPuerto RicoQatarRomaniaRussian FederationRwandaSamoaSan MarinoSao Tome and PrincipeSaudi ArabiaSenegalSerbiaSeychellesSierra LeoneSlovak RepublicSloveniaSmall statesSolomon IslandsSomaliaSouth AfricaSouth AsiaSouth Asia (IDA & IBRD)SpainSri LankaSt. Kitts and NevisSt. LuciaSt. Vincent and the GrenadinesSub-Saharan Africa Sub-Saharan Africa (excluding high income)Sub-Saharan Africa (IDA & IBRD countries)SudanSurinameSwazilandSwedenSwitzerlandSyrian Arab RepublicTajikistanTanzaniaThailandTimor-LesteTogoTongaTrinidad and TobagoTunisiaTurkeyTurkmenistanTuvaluUgandaUkraineUnited Arab EmiratesUnited KingdomUnited StatesUpper middle incomeUruguayUzbekistanVanuatuVenezuela, RBVietnamWest Bank and GazaWorldYemen, Rep.ZambiaZimbabwe Timeline:
This timeline shows a graph from 1971 to 2014 of Pacific island small states. No data until 1970. Number of actual observations by date: 44.
Source name:
World Development Indicators
Source organization:
United Nations Educational, Scientific, and Cultural Organization (UNESCO) Institute for Statistics.
Categories, topics:
Education, Gender
Last updated:
apr 23, 2017
Indicators value changes by year
Minimum:
47.933
jan 1, 1971
Maximum:
77.385
jan 1, 2012
At the date of observation
Value
Absolute change
Change from previous value
jan 1, 1971
47.933
+47.933
0.0%
jan 1, 1972
49.576
+1.643
3.43%
jan 1, 1973
51.642
+2.066
4.17%
jan 1, 1974
53.592
+1.95
3.78%
jan 1, 1975
56.676
+3.084
5.75%
jan 1, 1976
58.824
+2.149
3.79%
jan 1, 1977
60.766
+1.942
3.3%
jan 1, 1978
62.853
+2.087
3.43%
jan 1, 1979
63.796
+0.943
1.5%
jan 1, 1980
64.758
+0.962
1.51%
jan 1, 1981
64.752
-0.006
-0.01%
jan 1, 1982
64.671
-0.081
-0.12%
jan 1, 1983
66.203
+1.532
2.37%
jan 1, 1984
66.3
+0.096
0.15%
jan 1, 1985
65.24
-1.06
-1.6%
jan 1, 1986
62.857
-2.382
-3.65%
jan 1, 1987
62.523
-0.334
-0.53%
jan 1, 1988
63.053
+0.53
0.85%
jan 1, 1989
62.748
-0.305
-0.48%
jan 1, 1990
62.417
-0.331
-0.53%
jan 1, 1991
62.168
-0.249
-0.4%
jan 1, 1992
63.079
+0.911
1.47%
jan 1, 1993
65.827
+2.748
4.36%
jan 1, 1994
66.125
+0.298
0.45%
jan 1, 1995
66.335
+0.21
0.32%
jan 1, 1996
66.195
-0.139
-0.21%
jan 1, 1997
66.193
-0.002
0.0%
jan 1, 1998
66.74
+0.547
0.83%
jan 1, 1999
63.869
-2.871
-4.3%
jan 1, 2000
65.362
+1.492
2.34%
jan 1, 2001
64.93
-0.432
-0.66%
jan 1, 2002
65.683
+0.753
1.16%
jan 1, 2003
68.991
+3.308
5.04%
jan 1, 2004
70.514
+1.524
2.21%
jan 1, 2005
71.333
+0.818
1.16%
jan 1, 2006
71.133
-0.199
-0.28%
jan 1, 2007
72.805
+1.672
2.35%
jan 1, 2008
72.181
-0.624
-0.86%
jan 1, 2009
73.345
+1.165
1.61%
jan 1, 2010
75.434
+2.089
2.85%
jan 1, 2011
77.156
+1.722
2.28%
jan 1, 2012
77.385
+0.229
0.3%
jan 1, 2013
76.627
-0.758
-0.98%
jan 1, 2014
76.522
-0.105
-0.14%
Ranking of countries by current statistics by years


Comments: