29
/
en
AIzaSyAYiBZKx7MnpbEhh9jyipgxe19OcubqV5w
April 1, 2024
93011
Brunei Darussalam
BRN
true
2
1
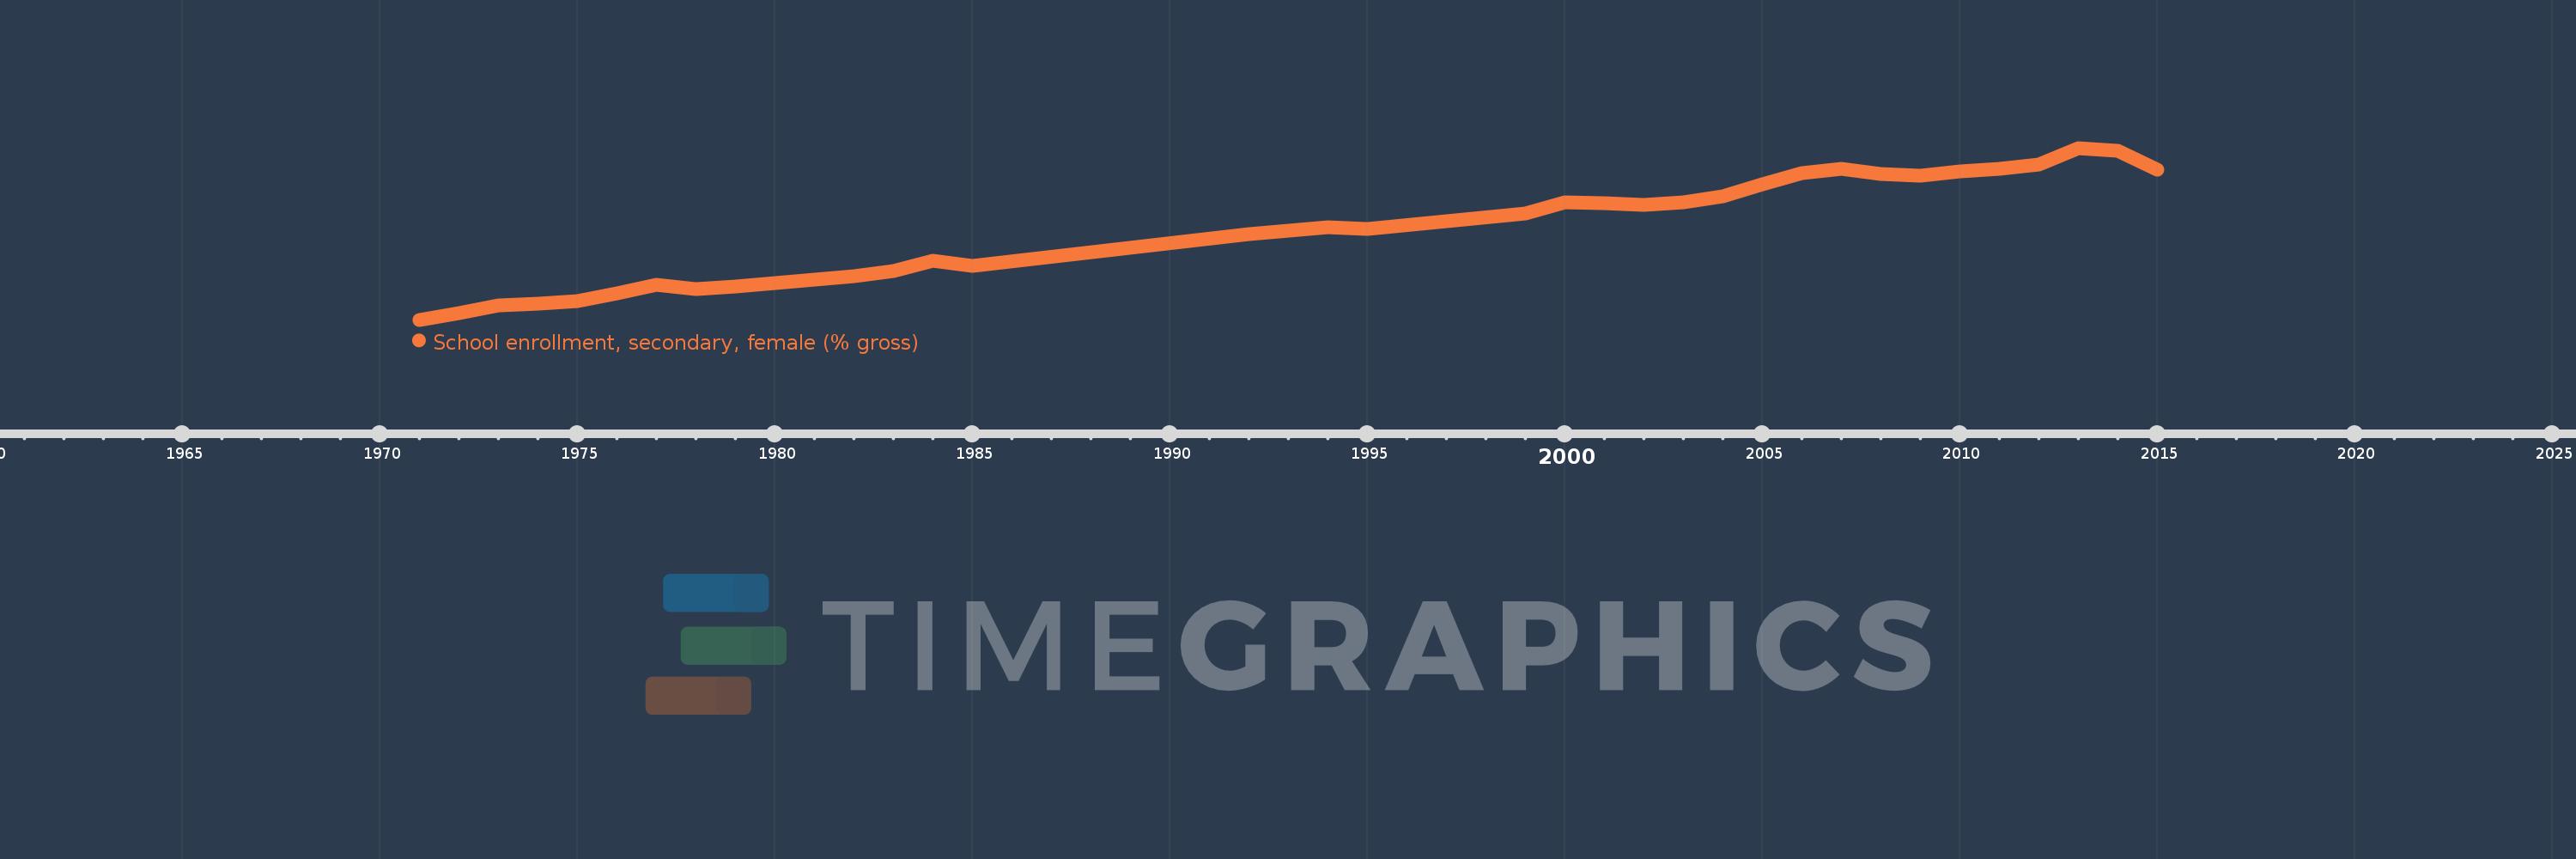
School enrollment, secondary, female (% gross)
2015,2014,2013,2012,2011,2010,2009,2008,2007,2006,2005,2004,2003,2002,2001,2000,1999,1995,1994,1993,1992,1985,1984,1983,1982,1981,1980,1979,1978,1977,1976,1975,1974,1973,1972,1971
This statistics in other country:
AfghanistanAlbaniaAlgeriaAndorraAngolaAntigua and BarbudaArab WorldArgentinaArmeniaArubaAustraliaAustriaAzerbaijanBahamas, TheBahrainBangladeshBarbadosBelarusBelgiumBelizeBeninBermudaBhutanBoliviaBosnia and HerzegovinaBotswanaBrazilBrunei DarussalamBulgariaBurkina FasoBurundiCabo VerdeCambodiaCameroonCanadaCaribbean small statesCentral African RepublicCentral Europe and the BalticsChadChileChinaColombiaComorosCongo, Dem. Rep.Congo, Rep.Costa RicaCote d'IvoireCroatiaCubaCuracaoCyprusCzech RepublicDenmarkDjiboutiDominicaDominican RepublicEarly-demographic dividendEast Asia & PacificEast Asia & Pacific (excluding high income)East Asia & Pacific (IDA & IBRD countries)EcuadorEgypt, Arab Rep.El SalvadorEquatorial GuineaEritreaEstoniaEthiopiaEuro areaEurope & Central AsiaEurope & Central Asia (excluding high income)Europe & Central Asia (IDA & IBRD countries)European UnionFijiFinlandFragile and conflict affected situationsFranceGabonGambia, TheGeorgiaGermanyGhanaGreeceGrenadaGuatemalaGuineaGuinea-BissauGuyanaHeavily indebted poor countries (HIPC)High incomeHondurasHong Kong SAR, ChinaHungaryIBRD onlyIcelandIDA & IBRD totalIDA blendIDA onlyIDA totalIndiaIndonesiaIran, Islamic Rep.IraqIrelandIsraelItalyJamaicaJapanJordanKazakhstanKenyaKiribatiKorea, Dem. People’s Rep.Korea, Rep.KuwaitKyrgyz RepublicLao PDRLate-demographic dividendLatin America & Caribbean Latin America & Caribbean (excluding high income)Latin America & the Caribbean (IDA & IBRD countries)LatviaLeast developed countries: UN classificationLebanonLesothoLiberiaLibyaLiechtensteinLithuaniaLow & middle incomeLow incomeLower middle incomeLuxembourgMacao SAR, ChinaMacedonia, FYRMadagascarMalawiMaldivesMaliMaltaMarshall IslandsMauritaniaMauritiusMexicoMicronesia, Fed. Sts.Middle East & North AfricaMiddle East & North Africa (excluding high income)Middle East & North Africa (IDA & IBRD countries)Middle incomeMoldovaMongoliaMontenegroMoroccoMozambiqueMyanmarNamibiaNauruNepalNetherlandsNew ZealandNicaraguaNigerNigeriaNorth AmericaNorwayOECD membersOmanOther small statesPacific island small statesPakistanPalauPanamaPapua New GuineaParaguayPeruPhilippinesPolandPortugalPost-demographic dividendPre-demographic dividendPuerto RicoQatarRomaniaRussian FederationRwandaSamoaSan MarinoSao Tome and PrincipeSaudi ArabiaSenegalSerbiaSeychellesSierra LeoneSlovak RepublicSloveniaSmall statesSolomon IslandsSomaliaSouth AfricaSouth AsiaSouth Asia (IDA & IBRD)SpainSri LankaSt. Kitts and NevisSt. LuciaSt. Vincent and the GrenadinesSub-Saharan Africa Sub-Saharan Africa (excluding high income)Sub-Saharan Africa (IDA & IBRD countries)SudanSurinameSwazilandSwedenSwitzerlandSyrian Arab RepublicTajikistanTanzaniaThailandTimor-LesteTogoTongaTrinidad and TobagoTunisiaTurkeyTurkmenistanTuvaluUgandaUkraineUnited Arab EmiratesUnited KingdomUnited StatesUpper middle incomeUruguayUzbekistanVanuatuVenezuela, RBVietnamWest Bank and GazaWorldYemen, Rep.ZambiaZimbabwe Timeline:
This timeline shows a graph from 1971 to 2015 of Brunei Darussalam. No data until 1970. Number of actual observations by date: 36.
Source name:
World Development Indicators
Source organization:
United Nations Educational, Scientific, and Cultural Organization (UNESCO) Institute for Statistics.
Categories, topics:
Education, Gender
Last updated:
apr 23, 2017
Indicators value changes by year
Minimum:
49.451
jan 1, 1971
Maximum:
106.437
jan 1, 2013
At the date of observation
Value
Absolute change
Change from previous value
jan 1, 1971
49.451
+49.451
0.0%
jan 1, 1972
51.538
+2.087
4.22%
jan 1, 1973
54.204
+2.666
5.17%
jan 1, 1974
54.838
+0.634
1.17%
jan 1, 1975
55.61
+0.772
1.41%
jan 1, 1976
58.091
+2.482
4.46%
jan 1, 1977
61.063
+2.971
5.11%
jan 1, 1978
59.719
-1.344
-2.2%
jan 1, 1979
60.435
+0.716
1.2%
jan 1, 1980
61.684
+1.249
2.07%
jan 1, 1981
62.8
+1.116
1.81%
jan 1, 1982
63.985
+1.185
1.89%
jan 1, 1983
65.662
+1.677
2.62%
jan 1, 1984
68.946
+3.284
5.0%
jan 1, 1985
67.363
-1.583
-2.3%
jan 1, 1992
77.835
+10.473
15.55%
jan 1, 1993
78.897
+1.062
1.36%
jan 1, 1994
80.05
+1.153
1.46%
jan 1, 1995
79.565
-0.485
-0.61%
jan 1, 1999
84.793
+5.227
6.57%
jan 1, 2000
88.327
+3.535
4.17%
jan 1, 2001
87.992
-0.335
-0.38%
jan 1, 2002
87.641
-0.351
-0.4%
jan 1, 2003
88.314
+0.673
0.77%
jan 1, 2004
90.292
+1.978
2.24%
jan 1, 2005
94.458
+4.167
4.61%
jan 1, 2006
98.047
+3.588
3.8%
jan 1, 2007
99.556
+1.509
1.54%
jan 1, 2008
97.699
-1.857
-1.87%
jan 1, 2009
97.142
-0.557
-0.57%
jan 1, 2010
98.748
+1.606
1.65%
jan 1, 2011
99.651
+0.902
0.91%
jan 1, 2012
100.886
+1.235
1.24%
jan 1, 2013
106.437
+5.551
5.5%
jan 1, 2014
105.497
-0.94
-0.88%
jan 1, 2015
99.101
-6.396
-6.06%
Ranking of countries by current statistics by years


Comments: