29
/
en
AIzaSyAYiBZKx7MnpbEhh9jyipgxe19OcubqV5w
April 1, 2024
133608
Finland
FIN
true
2
1
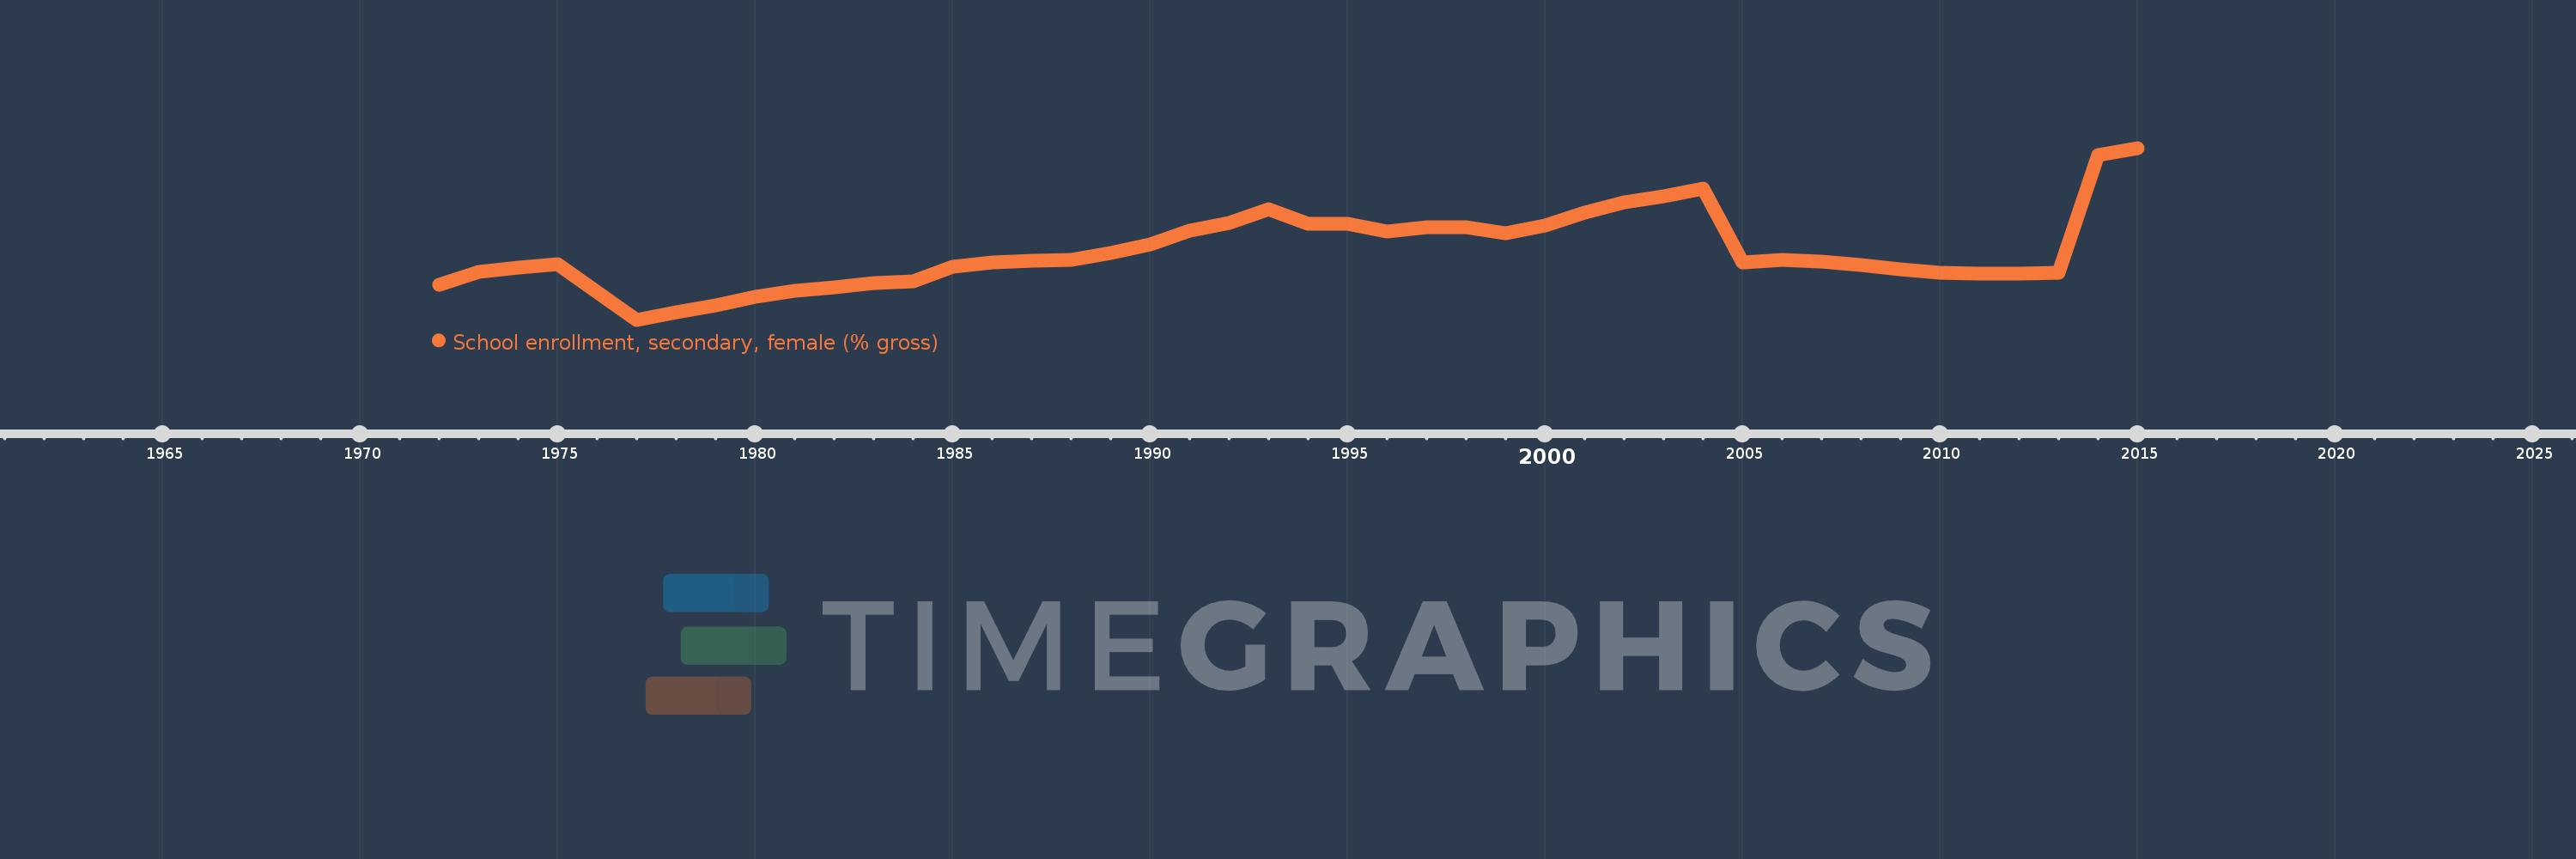
School enrollment, secondary, female (% gross)
2015,2014,2013,2012,2011,2010,2009,2008,2007,2006,2005,2004,2003,2002,2001,2000,1999,1998,1997,1996,1995,1994,1993,1992,1991,1990,1989,1988,1987,1986,1985,1984,1983,1982,1981,1980,1979,1978,1977,1975,1974,1973,1972
This statistics in other country:
AfghanistanAlbaniaAlgeriaAndorraAngolaAntigua and BarbudaArab WorldArgentinaArmeniaArubaAustraliaAustriaAzerbaijanBahamas, TheBahrainBangladeshBarbadosBelarusBelgiumBelizeBeninBermudaBhutanBoliviaBosnia and HerzegovinaBotswanaBrazilBrunei DarussalamBulgariaBurkina FasoBurundiCabo VerdeCambodiaCameroonCanadaCaribbean small statesCentral African RepublicCentral Europe and the BalticsChadChileChinaColombiaComorosCongo, Dem. Rep.Congo, Rep.Costa RicaCote d'IvoireCroatiaCubaCuracaoCyprusCzech RepublicDenmarkDjiboutiDominicaDominican RepublicEarly-demographic dividendEast Asia & PacificEast Asia & Pacific (excluding high income)East Asia & Pacific (IDA & IBRD countries)EcuadorEgypt, Arab Rep.El SalvadorEquatorial GuineaEritreaEstoniaEthiopiaEuro areaEurope & Central AsiaEurope & Central Asia (excluding high income)Europe & Central Asia (IDA & IBRD countries)European UnionFijiFinlandFragile and conflict affected situationsFranceGabonGambia, TheGeorgiaGermanyGhanaGreeceGrenadaGuatemalaGuineaGuinea-BissauGuyanaHeavily indebted poor countries (HIPC)High incomeHondurasHong Kong SAR, ChinaHungaryIBRD onlyIcelandIDA & IBRD totalIDA blendIDA onlyIDA totalIndiaIndonesiaIran, Islamic Rep.IraqIrelandIsraelItalyJamaicaJapanJordanKazakhstanKenyaKiribatiKorea, Dem. People’s Rep.Korea, Rep.KuwaitKyrgyz RepublicLao PDRLate-demographic dividendLatin America & Caribbean Latin America & Caribbean (excluding high income)Latin America & the Caribbean (IDA & IBRD countries)LatviaLeast developed countries: UN classificationLebanonLesothoLiberiaLibyaLiechtensteinLithuaniaLow & middle incomeLow incomeLower middle incomeLuxembourgMacao SAR, ChinaMacedonia, FYRMadagascarMalawiMaldivesMaliMaltaMarshall IslandsMauritaniaMauritiusMexicoMicronesia, Fed. Sts.Middle East & North AfricaMiddle East & North Africa (excluding high income)Middle East & North Africa (IDA & IBRD countries)Middle incomeMoldovaMongoliaMontenegroMoroccoMozambiqueMyanmarNamibiaNauruNepalNetherlandsNew ZealandNicaraguaNigerNigeriaNorth AmericaNorwayOECD membersOmanOther small statesPacific island small statesPakistanPalauPanamaPapua New GuineaParaguayPeruPhilippinesPolandPortugalPost-demographic dividendPre-demographic dividendPuerto RicoQatarRomaniaRussian FederationRwandaSamoaSan MarinoSao Tome and PrincipeSaudi ArabiaSenegalSerbiaSeychellesSierra LeoneSlovak RepublicSloveniaSmall statesSolomon IslandsSomaliaSouth AfricaSouth AsiaSouth Asia (IDA & IBRD)SpainSri LankaSt. Kitts and NevisSt. LuciaSt. Vincent and the GrenadinesSub-Saharan Africa Sub-Saharan Africa (excluding high income)Sub-Saharan Africa (IDA & IBRD countries)SudanSurinameSwazilandSwedenSwitzerlandSyrian Arab RepublicTajikistanTanzaniaThailandTimor-LesteTogoTongaTrinidad and TobagoTunisiaTurkeyTurkmenistanTuvaluUgandaUkraineUnited Arab EmiratesUnited KingdomUnited StatesUpper middle incomeUruguayUzbekistanVanuatuVenezuela, RBVietnamWest Bank and GazaWorldYemen, Rep.ZambiaZimbabwe Timeline:
This timeline shows a graph from 1972 to 2015 of Finland. No data until 1971. Number of actual observations by date: 43.
Source name:
World Development Indicators
Source organization:
United Nations Educational, Scientific, and Cultural Organization (UNESCO) Institute for Statistics.
Categories, topics:
Education, Gender
Last updated:
apr 23, 2017
Indicators value changes by year
Minimum:
94.277
jan 1, 1977
Maximum:
152.123
jan 1, 2015
At the date of observation
Value
Absolute change
Change from previous value
jan 1, 1972
106.011
+106.011
0.0%
jan 1, 1973
110.262
+4.251
4.01%
jan 1, 1974
111.856
+1.594
1.45%
jan 1, 1975
112.85
+0.994
0.89%
jan 1, 1977
94.277
-18.574
-16.46%
jan 1, 1978
96.935
+2.659
2.82%
jan 1, 1979
99.236
+2.301
2.37%
jan 1, 1980
102.11
+2.873
2.9%
jan 1, 1981
103.965
+1.856
1.82%
jan 1, 1982
105.167
+1.202
1.16%
jan 1, 1983
106.587
+1.419
1.35%
jan 1, 1984
107.325
+0.738
0.69%
jan 1, 1985
112.164
+4.839
4.51%
jan 1, 1986
113.534
+1.37
1.22%
jan 1, 1987
114.096
+0.561
0.49%
jan 1, 1988
114.328
+0.233
0.2%
jan 1, 1989
116.862
+2.534
2.22%
jan 1, 1990
119.606
+2.744
2.35%
jan 1, 1991
124.292
+4.686
3.92%
jan 1, 1992
126.986
+2.693
2.17%
jan 1, 1993
131.432
+4.447
3.5%
jan 1, 1994
126.516
-4.916
-3.74%
jan 1, 1995
126.633
+0.117
0.09%
jan 1, 1996
123.868
-2.766
-2.18%
jan 1, 1997
125.367
+1.499
1.21%
jan 1, 1998
125.432
+0.066
0.05%
jan 1, 1999
123.272
-2.16
-1.72%
jan 1, 2000
125.903
+2.631
2.13%
jan 1, 2001
130.439
+4.536
3.6%
jan 1, 2002
133.757
+3.318
2.54%
jan 1, 2003
135.826
+2.069
1.55%
jan 1, 2004
138.373
+2.548
1.88%
jan 1, 2005
113.553
-24.82
-17.94%
jan 1, 2006
114.512
+0.959
0.84%
jan 1, 2007
113.971
-0.542
-0.47%
jan 1, 2008
112.816
-1.154
-1.01%
jan 1, 2009
111.356
-1.46
-1.29%
jan 1, 2010
110.041
-1.315
-1.18%
jan 1, 2011
109.771
-0.27
-0.25%
jan 1, 2012
109.887
+0.116
0.11%
jan 1, 2013
109.986
+0.099
0.09%
jan 1, 2014
149.706
+39.72
36.11%
jan 1, 2015
152.123
+2.417
1.61%
Ranking of countries by current statistics by years


Comments: