29
/
en
AIzaSyAYiBZKx7MnpbEhh9jyipgxe19OcubqV5w
April 1, 2024
159874
Ireland
IRL
true
2
1
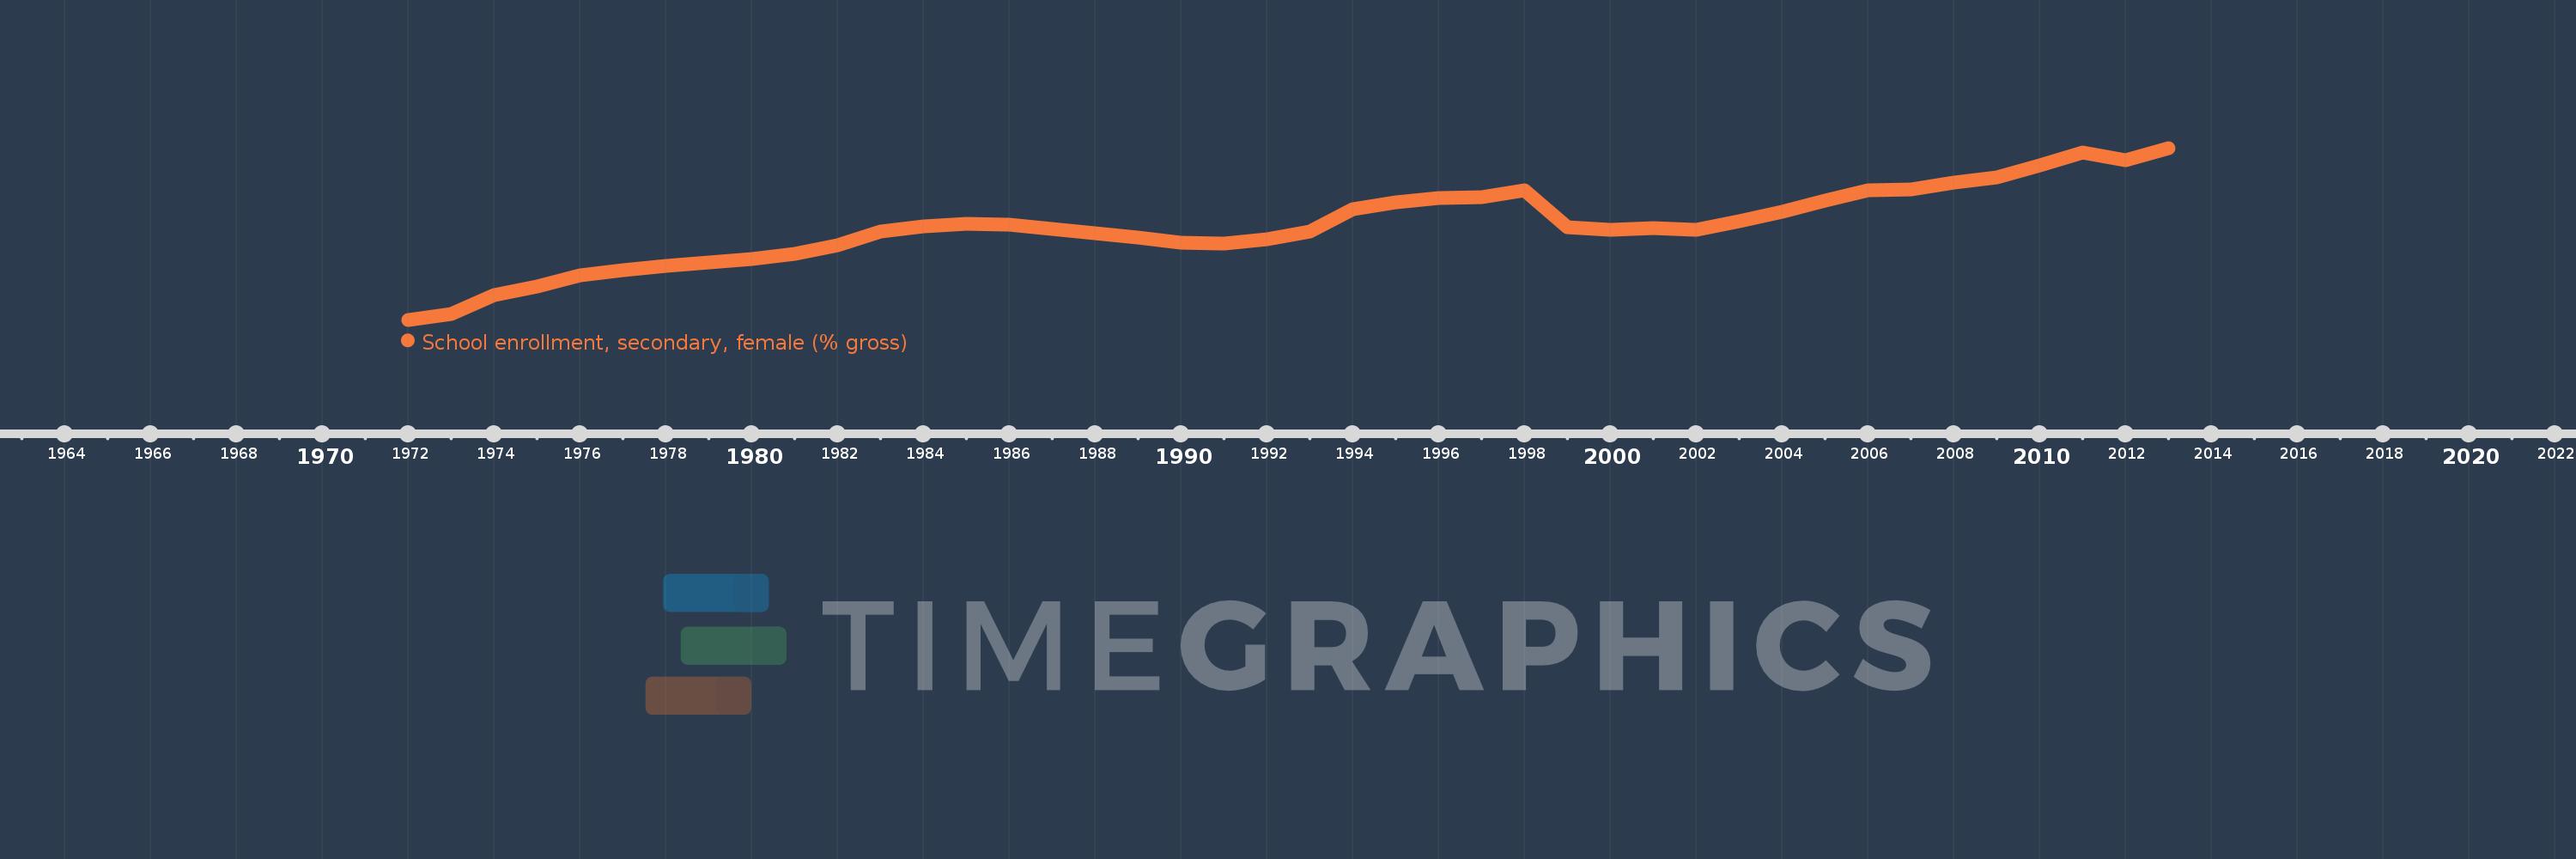
School enrollment, secondary, female (% gross)
2013,2012,2011,2010,2009,2008,2007,2006,2005,2004,2003,2002,2001,2000,1999,1998,1997,1996,1995,1994,1993,1992,1991,1990,1989,1988,1987,1986,1985,1984,1983,1982,1981,1980,1979,1978,1977,1976,1975,1974,1973,1972
This statistics in other country:
AfghanistanAlbaniaAlgeriaAndorraAngolaAntigua and BarbudaArab WorldArgentinaArmeniaArubaAustraliaAustriaAzerbaijanBahamas, TheBahrainBangladeshBarbadosBelarusBelgiumBelizeBeninBermudaBhutanBoliviaBosnia and HerzegovinaBotswanaBrazilBrunei DarussalamBulgariaBurkina FasoBurundiCabo VerdeCambodiaCameroonCanadaCaribbean small statesCentral African RepublicCentral Europe and the BalticsChadChileChinaColombiaComorosCongo, Dem. Rep.Congo, Rep.Costa RicaCote d'IvoireCroatiaCubaCuracaoCyprusCzech RepublicDenmarkDjiboutiDominicaDominican RepublicEarly-demographic dividendEast Asia & PacificEast Asia & Pacific (excluding high income)East Asia & Pacific (IDA & IBRD countries)EcuadorEgypt, Arab Rep.El SalvadorEquatorial GuineaEritreaEstoniaEthiopiaEuro areaEurope & Central AsiaEurope & Central Asia (excluding high income)Europe & Central Asia (IDA & IBRD countries)European UnionFijiFinlandFragile and conflict affected situationsFranceGabonGambia, TheGeorgiaGermanyGhanaGreeceGrenadaGuatemalaGuineaGuinea-BissauGuyanaHeavily indebted poor countries (HIPC)High incomeHondurasHong Kong SAR, ChinaHungaryIBRD onlyIcelandIDA & IBRD totalIDA blendIDA onlyIDA totalIndiaIndonesiaIran, Islamic Rep.IraqIrelandIsraelItalyJamaicaJapanJordanKazakhstanKenyaKiribatiKorea, Dem. People’s Rep.Korea, Rep.KuwaitKyrgyz RepublicLao PDRLate-demographic dividendLatin America & Caribbean Latin America & Caribbean (excluding high income)Latin America & the Caribbean (IDA & IBRD countries)LatviaLeast developed countries: UN classificationLebanonLesothoLiberiaLibyaLiechtensteinLithuaniaLow & middle incomeLow incomeLower middle incomeLuxembourgMacao SAR, ChinaMacedonia, FYRMadagascarMalawiMaldivesMaliMaltaMarshall IslandsMauritaniaMauritiusMexicoMicronesia, Fed. Sts.Middle East & North AfricaMiddle East & North Africa (excluding high income)Middle East & North Africa (IDA & IBRD countries)Middle incomeMoldovaMongoliaMontenegroMoroccoMozambiqueMyanmarNamibiaNauruNepalNetherlandsNew ZealandNicaraguaNigerNigeriaNorth AmericaNorwayOECD membersOmanOther small statesPacific island small statesPakistanPalauPanamaPapua New GuineaParaguayPeruPhilippinesPolandPortugalPost-demographic dividendPre-demographic dividendPuerto RicoQatarRomaniaRussian FederationRwandaSamoaSan MarinoSao Tome and PrincipeSaudi ArabiaSenegalSerbiaSeychellesSierra LeoneSlovak RepublicSloveniaSmall statesSolomon IslandsSomaliaSouth AfricaSouth AsiaSouth Asia (IDA & IBRD)SpainSri LankaSt. Kitts and NevisSt. LuciaSt. Vincent and the GrenadinesSub-Saharan Africa Sub-Saharan Africa (excluding high income)Sub-Saharan Africa (IDA & IBRD countries)SudanSurinameSwazilandSwedenSwitzerlandSyrian Arab RepublicTajikistanTanzaniaThailandTimor-LesteTogoTongaTrinidad and TobagoTunisiaTurkeyTurkmenistanTuvaluUgandaUkraineUnited Arab EmiratesUnited KingdomUnited StatesUpper middle incomeUruguayUzbekistanVanuatuVenezuela, RBVietnamWest Bank and GazaWorldYemen, Rep.ZambiaZimbabwe Timeline:
This timeline shows a graph from 1972 to 2013 of Ireland. No data until 1971. Number of actual observations by date: 42.
Source name:
World Development Indicators
Source organization:
United Nations Educational, Scientific, and Cultural Organization (UNESCO) Institute for Statistics.
Categories, topics:
Education, Gender
Last updated:
apr 23, 2017
Indicators value changes by year
Minimum:
76.186
jan 1, 1972
Maximum:
127.452
jan 1, 2013
At the date of observation
Value
Absolute change
Change from previous value
jan 1, 1972
76.186
+76.186
0.0%
jan 1, 1973
78.007
+1.821
2.39%
jan 1, 1974
83.562
+5.555
7.12%
jan 1, 1975
86.202
+2.64
3.16%
jan 1, 1976
89.314
+3.113
3.61%
jan 1, 1977
90.86
+1.545
1.73%
jan 1, 1978
92.3
+1.44
1.58%
jan 1, 1979
93.371
+1.071
1.16%
jan 1, 1980
94.247
+0.876
0.94%
jan 1, 1981
95.958
+1.711
1.81%
jan 1, 1982
98.394
+2.436
2.54%
jan 1, 1983
102.384
+3.99
4.05%
jan 1, 1984
104.03
+1.646
1.61%
jan 1, 1985
104.869
+0.839
0.81%
jan 1, 1986
104.559
-0.309
-0.3%
jan 1, 1987
103.188
-1.371
-1.31%
jan 1, 1988
102.059
-1.129
-1.09%
jan 1, 1989
100.595
-1.464
-1.43%
jan 1, 1990
99.144
-1.452
-1.44%
jan 1, 1991
98.98
-0.164
-0.17%
jan 1, 1992
100.1
+1.12
1.13%
jan 1, 1993
102.63
+2.53
2.53%
jan 1, 1994
109.084
+6.454
6.29%
jan 1, 1995
111.261
+2.177
2.0%
jan 1, 1996
112.481
+1.22
1.1%
jan 1, 1997
112.815
+0.335
0.3%
jan 1, 1998
114.917
+2.102
1.86%
jan 1, 1999
103.732
-11.185
-9.73%
jan 1, 2000
103.015
-0.717
-0.69%
jan 1, 2001
103.427
+0.412
0.4%
jan 1, 2002
103.112
-0.315
-0.3%
jan 1, 2003
105.509
+2.397
2.32%
jan 1, 2004
108.526
+3.016
2.86%
jan 1, 2005
111.816
+3.29
3.03%
jan 1, 2006
114.698
+2.882
2.58%
jan 1, 2007
115.198
+0.5
0.44%
jan 1, 2008
117.04
+1.842
1.6%
jan 1, 2009
118.567
+1.526
1.3%
jan 1, 2010
122.176
+3.61
3.04%
jan 1, 2011
126.221
+4.045
3.31%
jan 1, 2012
123.816
-2.406
-1.91%
jan 1, 2013
127.452
+3.636
2.94%
Ranking of countries by current statistics by years


Comments: