29
/
en
AIzaSyAYiBZKx7MnpbEhh9jyipgxe19OcubqV5w
April 1, 2024
44648
Least developed countries: UN classification
LDC
false
2
1
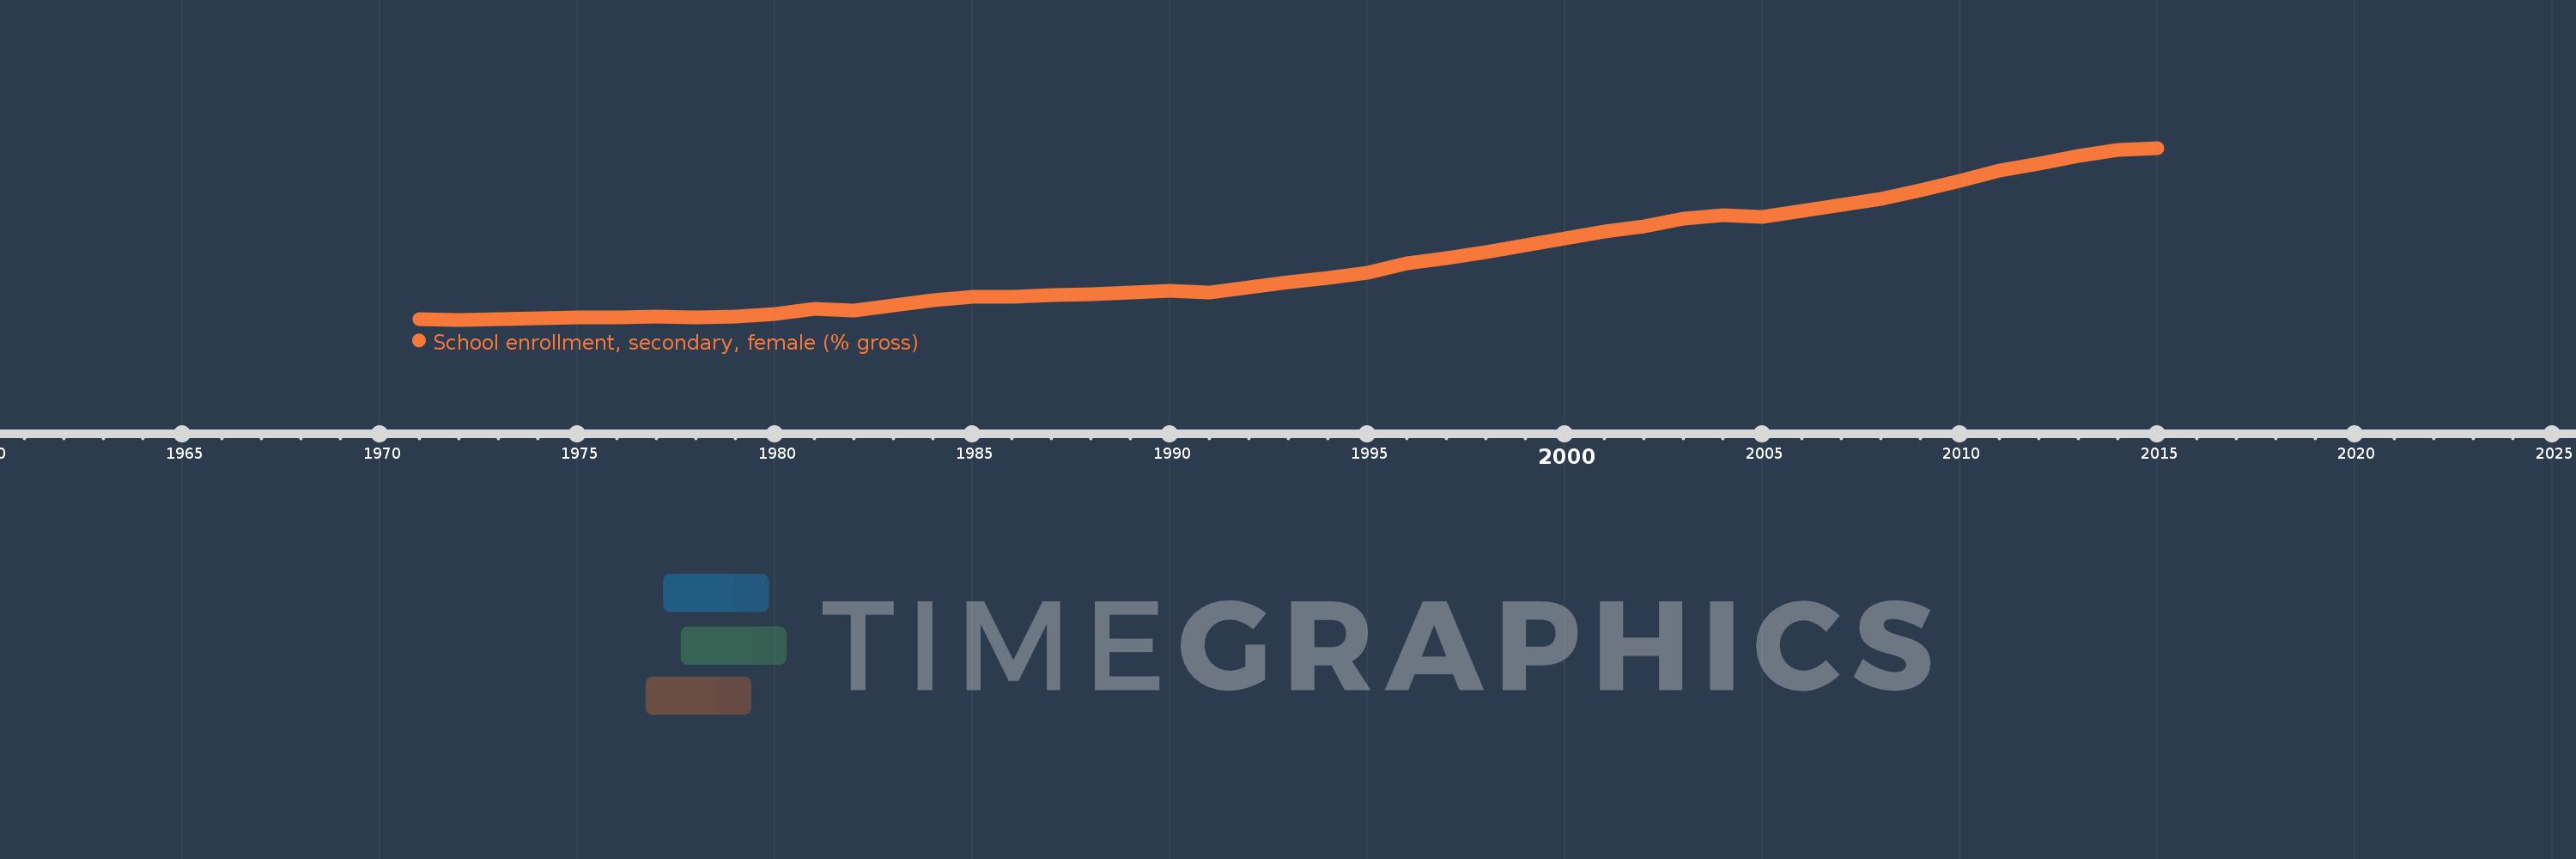
School enrollment, secondary, female (% gross)
2015,2014,2013,2012,2011,2010,2009,2008,2007,2006,2005,2004,2003,2002,2001,2000,1999,1998,1997,1996,1995,1994,1993,1992,1991,1990,1989,1988,1987,1986,1985,1984,1983,1982,1981,1980,1979,1978,1977,1976,1975,1974,1973,1972,1971
This statistics in other country:
AfghanistanAlbaniaAlgeriaAndorraAngolaAntigua and BarbudaArab WorldArgentinaArmeniaArubaAustraliaAustriaAzerbaijanBahamas, TheBahrainBangladeshBarbadosBelarusBelgiumBelizeBeninBermudaBhutanBoliviaBosnia and HerzegovinaBotswanaBrazilBrunei DarussalamBulgariaBurkina FasoBurundiCabo VerdeCambodiaCameroonCanadaCaribbean small statesCentral African RepublicCentral Europe and the BalticsChadChileChinaColombiaComorosCongo, Dem. Rep.Congo, Rep.Costa RicaCote d'IvoireCroatiaCubaCuracaoCyprusCzech RepublicDenmarkDjiboutiDominicaDominican RepublicEarly-demographic dividendEast Asia & PacificEast Asia & Pacific (excluding high income)East Asia & Pacific (IDA & IBRD countries)EcuadorEgypt, Arab Rep.El SalvadorEquatorial GuineaEritreaEstoniaEthiopiaEuro areaEurope & Central AsiaEurope & Central Asia (excluding high income)Europe & Central Asia (IDA & IBRD countries)European UnionFijiFinlandFragile and conflict affected situationsFranceGabonGambia, TheGeorgiaGermanyGhanaGreeceGrenadaGuatemalaGuineaGuinea-BissauGuyanaHeavily indebted poor countries (HIPC)High incomeHondurasHong Kong SAR, ChinaHungaryIBRD onlyIcelandIDA & IBRD totalIDA blendIDA onlyIDA totalIndiaIndonesiaIran, Islamic Rep.IraqIrelandIsraelItalyJamaicaJapanJordanKazakhstanKenyaKiribatiKorea, Dem. People’s Rep.Korea, Rep.KuwaitKyrgyz RepublicLao PDRLate-demographic dividendLatin America & Caribbean Latin America & Caribbean (excluding high income)Latin America & the Caribbean (IDA & IBRD countries)LatviaLeast developed countries: UN classificationLebanonLesothoLiberiaLibyaLiechtensteinLithuaniaLow & middle incomeLow incomeLower middle incomeLuxembourgMacao SAR, ChinaMacedonia, FYRMadagascarMalawiMaldivesMaliMaltaMarshall IslandsMauritaniaMauritiusMexicoMicronesia, Fed. Sts.Middle East & North AfricaMiddle East & North Africa (excluding high income)Middle East & North Africa (IDA & IBRD countries)Middle incomeMoldovaMongoliaMontenegroMoroccoMozambiqueMyanmarNamibiaNauruNepalNetherlandsNew ZealandNicaraguaNigerNigeriaNorth AmericaNorwayOECD membersOmanOther small statesPacific island small statesPakistanPalauPanamaPapua New GuineaParaguayPeruPhilippinesPolandPortugalPost-demographic dividendPre-demographic dividendPuerto RicoQatarRomaniaRussian FederationRwandaSamoaSan MarinoSao Tome and PrincipeSaudi ArabiaSenegalSerbiaSeychellesSierra LeoneSlovak RepublicSloveniaSmall statesSolomon IslandsSomaliaSouth AfricaSouth AsiaSouth Asia (IDA & IBRD)SpainSri LankaSt. Kitts and NevisSt. LuciaSt. Vincent and the GrenadinesSub-Saharan Africa Sub-Saharan Africa (excluding high income)Sub-Saharan Africa (IDA & IBRD countries)SudanSurinameSwazilandSwedenSwitzerlandSyrian Arab RepublicTajikistanTanzaniaThailandTimor-LesteTogoTongaTrinidad and TobagoTunisiaTurkeyTurkmenistanTuvaluUgandaUkraineUnited Arab EmiratesUnited KingdomUnited StatesUpper middle incomeUruguayUzbekistanVanuatuVenezuela, RBVietnamWest Bank and GazaWorldYemen, Rep.ZambiaZimbabwe Timeline:
This timeline shows a graph from 1971 to 2015 of Least developed countries: UN classification. No data until 1970. Number of actual observations by date: 45.
Source name:
World Development Indicators
Source organization:
United Nations Educational, Scientific, and Cultural Organization (UNESCO) Institute for Statistics.
Categories, topics:
Education, Gender
Last updated:
apr 23, 2017
Indicators value changes by year
Maximum:
40.015
jan 1, 2015
At the date of observation
Value
Absolute change
Change from previous value
jan 1, 1971
8.39
+8.39
0.0%
jan 1, 1972
8.344
-0.046
-0.54%
jan 1, 1973
8.45
+0.106
1.28%
jan 1, 1974
8.674
+0.223
2.64%
jan 1, 1975
8.693
+0.019
0.22%
jan 1, 1976
8.814
+0.121
1.39%
jan 1, 1977
8.915
+0.101
1.14%
jan 1, 1978
8.754
-0.16
-1.8%
jan 1, 1979
8.965
+0.21
2.4%
jan 1, 1980
9.363
+0.398
4.44%
jan 1, 1981
10.314
+0.951
10.16%
jan 1, 1982
10.095
-0.219
-2.12%
jan 1, 1983
11.06
+0.965
9.56%
jan 1, 1984
11.935
+0.875
7.91%
jan 1, 1985
12.631
+0.696
5.83%
jan 1, 1986
12.56
-0.071
-0.56%
jan 1, 1987
12.933
+0.373
2.97%
jan 1, 1988
13.121
+0.188
1.45%
jan 1, 1989
13.436
+0.314
2.4%
jan 1, 1990
13.654
+0.219
1.63%
jan 1, 1991
13.388
-0.267
-1.95%
jan 1, 1992
14.368
+0.98
7.32%
jan 1, 1993
15.249
+0.881
6.13%
jan 1, 1994
16.048
+0.799
5.24%
jan 1, 1995
17.008
+0.961
5.99%
jan 1, 1996
18.728
+1.72
10.11%
jan 1, 1997
19.774
+1.047
5.59%
jan 1, 1998
20.769
+0.995
5.03%
jan 1, 1999
22.149
+1.379
6.64%
jan 1, 2000
23.28
+1.132
5.11%
jan 1, 2001
24.553
+1.273
5.47%
jan 1, 2002
25.609
+1.056
4.3%
jan 1, 2003
26.995
+1.386
5.41%
jan 1, 2004
27.543
+0.549
2.03%
jan 1, 2005
27.366
-0.177
-0.64%
jan 1, 2006
28.363
+0.997
3.64%
jan 1, 2007
29.556
+1.193
4.21%
jan 1, 2008
30.651
+1.095
3.7%
jan 1, 2009
32.217
+1.566
5.11%
jan 1, 2010
33.89
+1.673
5.19%
jan 1, 2011
35.845
+1.955
5.77%
jan 1, 2012
37.161
+1.316
3.67%
jan 1, 2013
38.492
+1.331
3.58%
jan 1, 2014
39.651
+1.158
3.01%
jan 1, 2015
40.015
+0.364
0.92%
Ranking of countries by current statistics by years


Comments: