29
/
en
AIzaSyAYiBZKx7MnpbEhh9jyipgxe19OcubqV5w
April 1, 2024
141098
Ghana
GHA
true
2
1
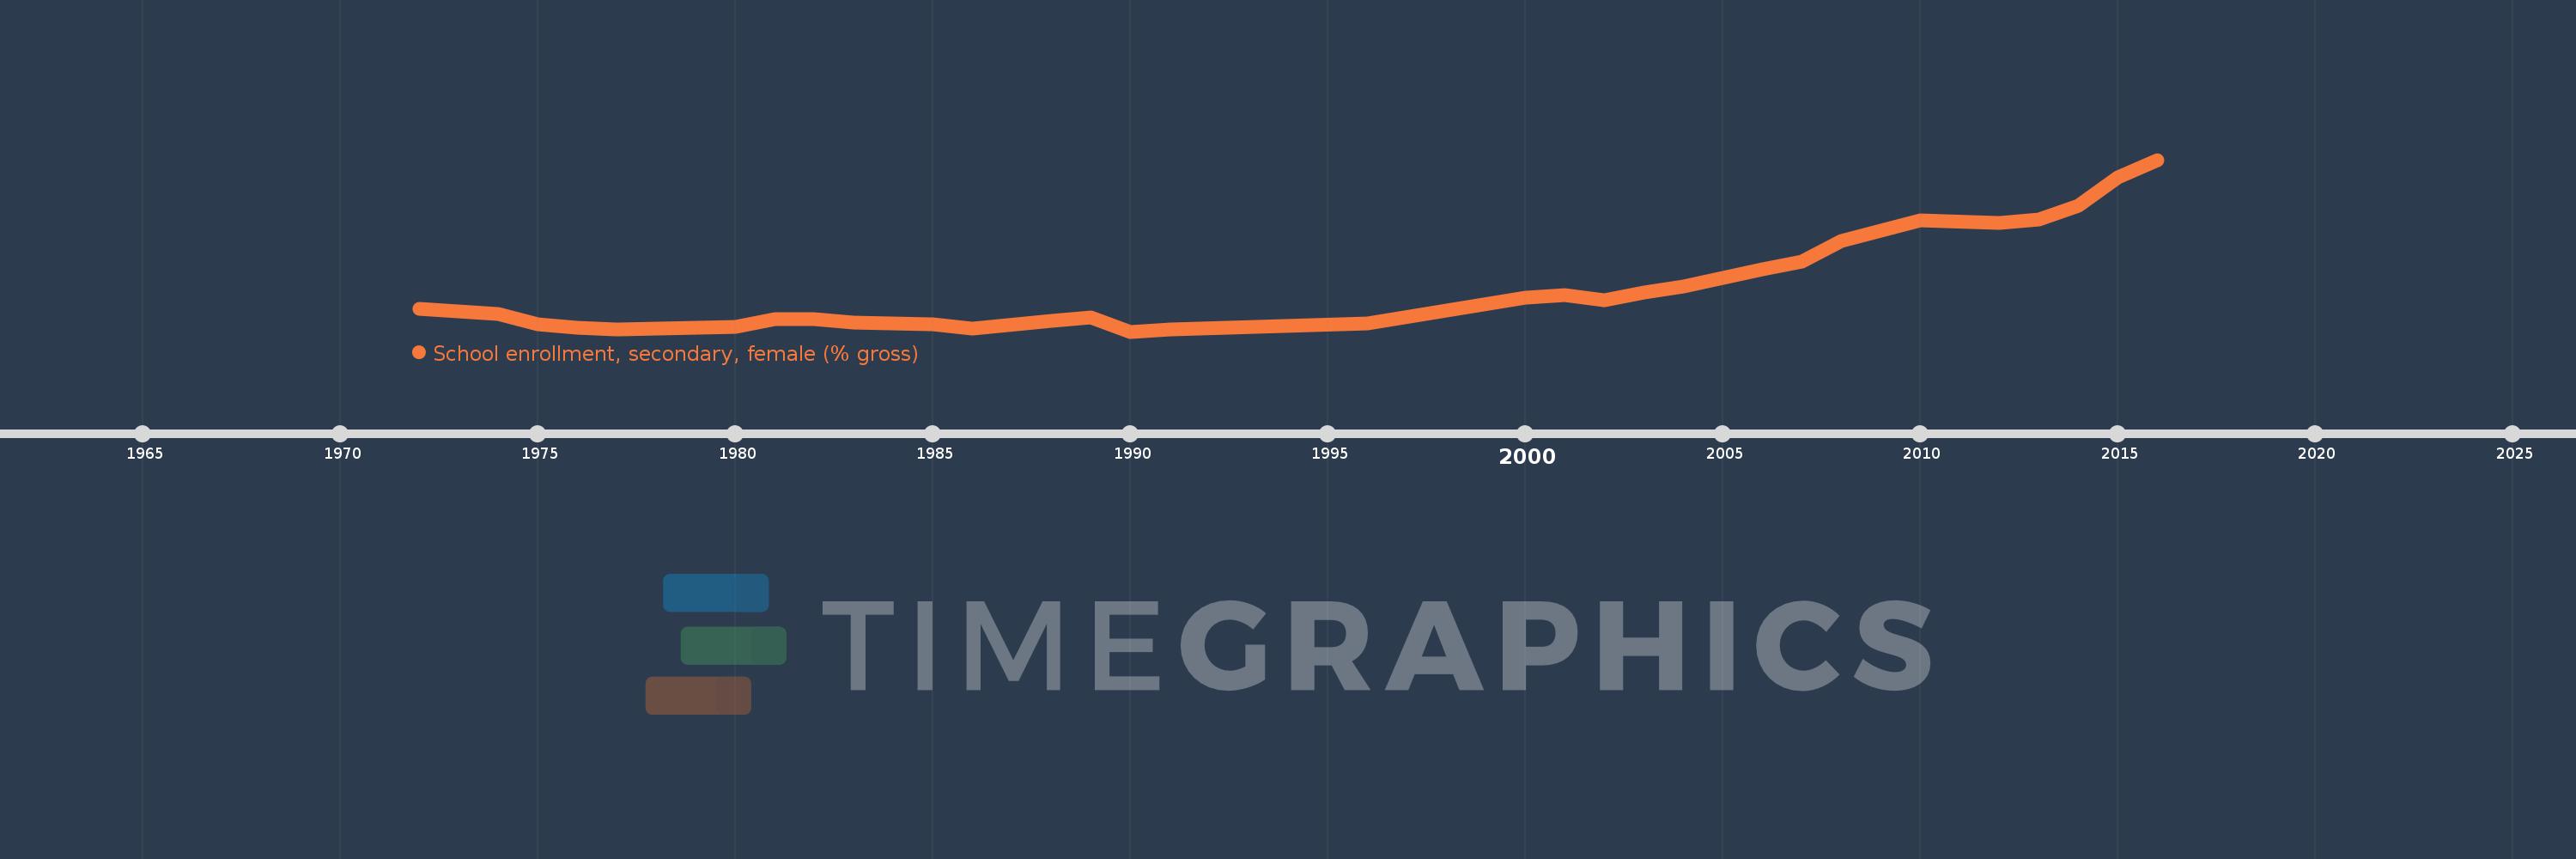
School enrollment, secondary, female (% gross)
2016,2015,2014,2013,2012,2010,2009,2008,2007,2006,2005,2004,2003,2002,2001,2000,1996,1991,1990,1989,1988,1986,1985,1984,1983,1982,1981,1980,1979,1978,1977,1976,1975,1974,1972
This statistics in other country:
AfghanistanAlbaniaAlgeriaAndorraAngolaAntigua and BarbudaArab WorldArgentinaArmeniaArubaAustraliaAustriaAzerbaijanBahamas, TheBahrainBangladeshBarbadosBelarusBelgiumBelizeBeninBermudaBhutanBoliviaBosnia and HerzegovinaBotswanaBrazilBrunei DarussalamBulgariaBurkina FasoBurundiCabo VerdeCambodiaCameroonCanadaCaribbean small statesCentral African RepublicCentral Europe and the BalticsChadChileChinaColombiaComorosCongo, Dem. Rep.Congo, Rep.Costa RicaCote d'IvoireCroatiaCubaCuracaoCyprusCzech RepublicDenmarkDjiboutiDominicaDominican RepublicEarly-demographic dividendEast Asia & PacificEast Asia & Pacific (excluding high income)East Asia & Pacific (IDA & IBRD countries)EcuadorEgypt, Arab Rep.El SalvadorEquatorial GuineaEritreaEstoniaEthiopiaEuro areaEurope & Central AsiaEurope & Central Asia (excluding high income)Europe & Central Asia (IDA & IBRD countries)European UnionFijiFinlandFragile and conflict affected situationsFranceGabonGambia, TheGeorgiaGermanyGhanaGreeceGrenadaGuatemalaGuineaGuinea-BissauGuyanaHeavily indebted poor countries (HIPC)High incomeHondurasHong Kong SAR, ChinaHungaryIBRD onlyIcelandIDA & IBRD totalIDA blendIDA onlyIDA totalIndiaIndonesiaIran, Islamic Rep.IraqIrelandIsraelItalyJamaicaJapanJordanKazakhstanKenyaKiribatiKorea, Dem. People’s Rep.Korea, Rep.KuwaitKyrgyz RepublicLao PDRLate-demographic dividendLatin America & Caribbean Latin America & Caribbean (excluding high income)Latin America & the Caribbean (IDA & IBRD countries)LatviaLeast developed countries: UN classificationLebanonLesothoLiberiaLibyaLiechtensteinLithuaniaLow & middle incomeLow incomeLower middle incomeLuxembourgMacao SAR, ChinaMacedonia, FYRMadagascarMalawiMaldivesMaliMaltaMarshall IslandsMauritaniaMauritiusMexicoMicronesia, Fed. Sts.Middle East & North AfricaMiddle East & North Africa (excluding high income)Middle East & North Africa (IDA & IBRD countries)Middle incomeMoldovaMongoliaMontenegroMoroccoMozambiqueMyanmarNamibiaNauruNepalNetherlandsNew ZealandNicaraguaNigerNigeriaNorth AmericaNorwayOECD membersOmanOther small statesPacific island small statesPakistanPalauPanamaPapua New GuineaParaguayPeruPhilippinesPolandPortugalPost-demographic dividendPre-demographic dividendPuerto RicoQatarRomaniaRussian FederationRwandaSamoaSan MarinoSao Tome and PrincipeSaudi ArabiaSenegalSerbiaSeychellesSierra LeoneSlovak RepublicSloveniaSmall statesSolomon IslandsSomaliaSouth AfricaSouth AsiaSouth Asia (IDA & IBRD)SpainSri LankaSt. Kitts and NevisSt. LuciaSt. Vincent and the GrenadinesSub-Saharan Africa Sub-Saharan Africa (excluding high income)Sub-Saharan Africa (IDA & IBRD countries)SudanSurinameSwazilandSwedenSwitzerlandSyrian Arab RepublicTajikistanTanzaniaThailandTimor-LesteTogoTongaTrinidad and TobagoTunisiaTurkeyTurkmenistanTuvaluUgandaUkraineUnited Arab EmiratesUnited KingdomUnited StatesUpper middle incomeUruguayUzbekistanVanuatuVenezuela, RBVietnamWest Bank and GazaWorldYemen, Rep.ZambiaZimbabwe Timeline:
This timeline shows a graph from 1972 to 2016 of Ghana. No data until 1971. Number of actual observations by date: 35.
Source name:
World Development Indicators
Source organization:
United Nations Educational, Scientific, and Cultural Organization (UNESCO) Institute for Statistics.
Categories, topics:
Education, Gender
Last updated:
apr 23, 2017
Indicators value changes by year
Minimum:
28.125
jan 1, 1990
Maximum:
69.127
jan 1, 2016
At the date of observation
Value
Absolute change
Change from previous value
jan 1, 1972
33.544
+33.544
0.0%
jan 1, 1974
32.314
-1.23
-3.67%
jan 1, 1975
29.965
-2.348
-7.27%
jan 1, 1976
28.994
-0.971
-3.24%
jan 1, 1977
28.687
-0.307
-1.06%
jan 1, 1978
28.781
+0.093
0.32%
jan 1, 1979
29.126
+0.346
1.2%
jan 1, 1980
29.258
+0.132
0.45%
jan 1, 1981
31.005
+1.748
5.97%
jan 1, 1982
31.026
+0.02
0.06%
jan 1, 1983
30.367
-0.658
-2.12%
jan 1, 1984
30.088
-0.279
-0.92%
jan 1, 1985
29.786
-0.302
-1.0%
jan 1, 1986
28.786
-1.0
-3.36%
jan 1, 1988
30.649
+1.863
6.47%
jan 1, 1989
31.41
+0.761
2.48%
jan 1, 1990
28.125
-3.285
-10.46%
jan 1, 1991
28.578
+0.453
1.61%
jan 1, 1996
29.979
+1.402
4.9%
jan 1, 2000
36.277
+6.298
21.01%
jan 1, 2001
36.87
+0.593
1.63%
jan 1, 2002
35.629
-1.241
-3.37%
jan 1, 2003
37.539
+1.91
5.36%
jan 1, 2004
38.872
+1.333
3.55%
jan 1, 2005
40.906
+2.033
5.23%
jan 1, 2006
42.886
+1.981
4.84%
jan 1, 2007
44.853
+1.967
4.59%
jan 1, 2008
49.737
+4.883
10.89%
jan 1, 2009
52.202
+2.465
4.96%
jan 1, 2010
54.739
+2.538
4.86%
jan 1, 2012
53.988
-0.752
-1.37%
jan 1, 2013
54.87
+0.882
1.63%
jan 1, 2014
58.155
+3.285
5.99%
jan 1, 2015
64.914
+6.759
11.62%
jan 1, 2016
69.127
+4.213
6.49%
Ranking of countries by current statistics by years


Comments: